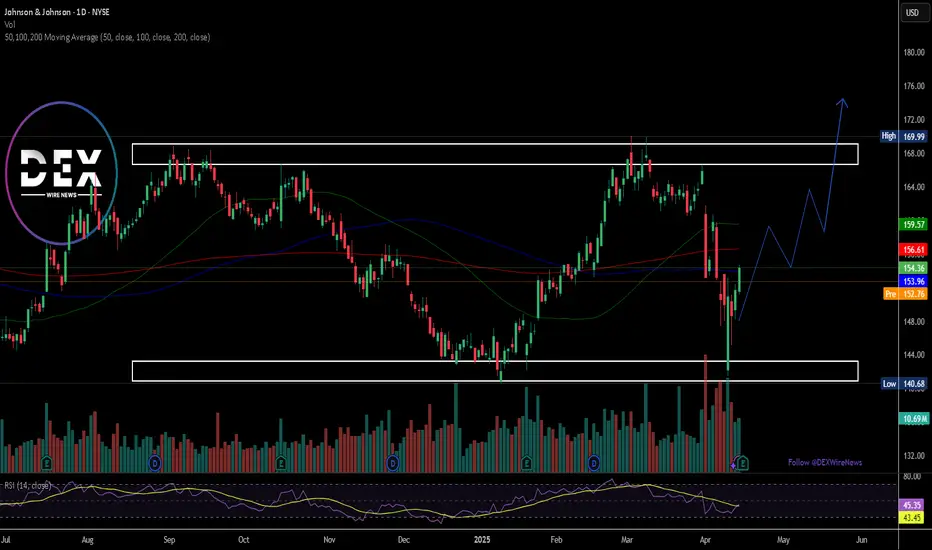
JOHNSON AND JOHNSON: Re-accumulation is targeting $175.JNJ is neutral on its 1D technical outlook (RSI = 49.991, MACD = -1.040, ADX = 18.184) as it's only trading around its 1W MA50 but having made an impressive rebound 4 weeks ago inside the Demand Zone. This is the 4th time this Demand Zone provided a rally and the last one even crossed over the 3 yea
Next report date
≈
July 22
Report period
Q2 2025
EPS estimate
11.39 K COP
Revenue estimate
97.19 T COP
37,760 COP
61.96 T COP
391.27 T COP
2.41 B
About Johnson & Johnson
Sector
Industry
CEO
Joaquin Duato
Website
Headquarters
New Brunswick
Founded
1887
FIGI
BBG001BJ1R75
Johnson & Johnson is a holding company, which engages in the research and development, manufacture and sale of products in the health care field. It operates through the following segments: Consumer Health, Pharmaceutical, and Medical Devices. The Consumer Health segment includes products used in the baby care, oral care, beauty, over-the-counter pharmaceutical, women's health, and wound care markets. The Pharmaceutical segment focuses on therapeutic areas, such as immunology, infectious diseases, neuroscience, oncology, pulmonary hypertension, and cardiovascular & metabolic diseases. The Medical Devices segment offers products used in the orthopedic, surgery, cardiovascular & neurovascular, and eye health fields. The company was founded by Robert Wood Johnson I, James Wood Johnson and Edward Mead Johnson Sr. in 1886 and is headquartered in New Brunswick, NJ.
10%
21%
32%
43%
54%
Q1 '24
Q2 '24
Q3 '24
Q4 '24
Q1 '25
0.00
25.00 T
50.00 T
75.00 T
100.00 T
Revenue
Net income
Net margin %
Revenue
COGS
Gross profit
Op expenses
Op income
Non-Op income/ expenses
Taxes & Other
Net income
0.00
25.00 T
50.00 T
75.00 T
100.00 T
Revenue
COGS
Gross profit
Expenses & adjustments
Net income
0.00
25.00 T
50.00 T
75.00 T
100.00 T
Q1 '24
Q2 '24
Q3 '24
Q4 '24
Q1 '25
0.00
60.00 T
120.00 T
180.00 T
240.00 T
Debt
Free cash flow
Cash & equivalents
No news here
Looks like there's nothing to report right now

JNJ - 2 scenariosHi traders,
JNJ is currently consolidating inside a symmetrical triangle.
We can expect two scenarios:
Bullish scenario:
Open a long position if the price breaks the downsloping resistance line.
SL: below $153.50
Potential TP: $164
Bearish scenario:
Open a short position if the price breaks down a


Buy JNJ for Stable Gains Amid Earnings Optimism Next Week
- Key Insights: Johnson & Johnson demonstrated robust earnings performance with
an EPS of $2.77, surpassing consensus estimates and reinforcing its
defensive stock status. Its diverse portfolio and consistent ability to
execute in volatile markets make it a strong candidate for growth-oriente

Johnson & Johnson Wave Analysis – 18 April 2025
- Johnson & Johnson rising inside weekly price range
- Likely to test resistance level 165.60
Johnson & Johnson continues to rise in the primary upward impulse wave 3, which started earlier from the major support level 145.00 (lower border of the weekly sideways price range from 2023).
The up

Johnson & Johnson Beats Q1 Estimates, Premarket Not Doing WellJohnson & Johnson (NYSE: NYSE:JNJ ) on Tuesday reported better-than-expected Q1 results and lifted its sales forecast for the full year.
Johnson & Johnson (NYSE: NYSE:JNJ ), together with its subsidiaries, engages in the research and development, manufacture, and sale of various products in the h
Johnson & Johnson (JNJ) Shares Drop Over 7%Johnson & Johnson (JNJ) Shares Drop Over 7%
As the chart shows, Johnson & Johnson (JNJ) shares declined by approximately 7.6%, reaching their lowest level since late February. This marked one of the worst performances in the stock market yesterday.
Why Did JNJ Shares Fall?
Two major bearish fac


See all ideas
Summarizing what the indicators are suggesting.
Neutral
SellBuy
Strong sellStrong buy
Strong sellSellNeutralBuyStrong buy
Neutral
SellBuy
Strong sellStrong buy
Strong sellSellNeutralBuyStrong buy
Neutral
SellBuy
Strong sellStrong buy
Strong sellSellNeutralBuyStrong buy
An aggregate view of professional's ratings.
Neutral
SellBuy
Strong sellStrong buy
Strong sellSellNeutralBuyStrong buy
Neutral
SellBuy
Strong sellStrong buy
Strong sellSellNeutralBuyStrong buy
Neutral
SellBuy
Strong sellStrong buy
Strong sellSellNeutralBuyStrong buy
Displays a symbol's price movements over previous years to identify recurring trends.
US478160CS1
JOHNSON&JOHN 20/50Yield to maturity
7.03%
Maturity date
Sep 1, 2050
US478160CT9
JOHNSON&JOHN 20/60Yield to maturity
6.95%
Maturity date
Sep 1, 2060
US478160CR3
JOHNSON&JOHN 20/40Yield to maturity
6.45%
Maturity date
Sep 1, 2040
US478160CM4
JOHNSON & JOHNSON 17/48Yield to maturity
6.22%
Maturity date
Jan 15, 2048
JNJJ
JOHNSON & JOHNSON 17/47Yield to maturity
6.07%
Maturity date
Mar 3, 2047
US478160BV5
JOHNSON & JOHNSON 16/46Yield to maturity
6.04%
Maturity date
Mar 1, 2046
US478160CL6
JOHNSON & JOHNSON 17/38Yield to maturity
5.58%
Maturity date
Jan 15, 2038
US478160CX0
JOHNSON&JOHN 24/54Yield to maturity
5.56%
Maturity date
Jun 1, 2054
JNJ4077469
Johnson & Johnson 4.5% 05-DEC-2043Yield to maturity
5.49%
Maturity date
Dec 5, 2043
JNJ.GT
Johnson & Johnson 4.5% 01-SEP-2040Yield to maturity
5.40%
Maturity date
Sep 1, 2040
US478160CF9
JOHNSON & JOHNSON 17/37Yield to maturity
5.37%
Maturity date
Mar 3, 2037
See all JNJ bonds
Curated watchlists where JNJ is featured.


Frequently Asked Questions
The current price of JNJ is 665,200 COP — it hasn't changed in the past 24 hours. Watch JOHNSON & JOHNSON stock price performance more closely on the chart.
Depending on the exchange, the stock ticker may vary. For instance, on BVC exchange JOHNSON & JOHNSON stocks are traded under the ticker JNJ.
JNJ stock has risen by 1.50% compared to the previous week, the month change is a 1.56% rise, over the last year JOHNSON & JOHNSON has showed a 14.40% increase.
We've gathered analysts' opinions on JOHNSON & JOHNSON future price: according to them, JNJ price has a max estimate of 787,234.04 COP and a min estimate of 659,574.47 COP. Watch JNJ chart and read a more detailed JOHNSON & JOHNSON stock forecast: see what analysts think of JOHNSON & JOHNSON and suggest that you do with its stocks.
JNJ stock is 0.56% volatile and has beta coefficient of 0.14. Track JOHNSON & JOHNSON stock price on the chart and check out the list of the most volatile stocks — is JOHNSON & JOHNSON there?
Today JOHNSON & JOHNSON has the market capitalization of 1,581.48 T, it has decreased by −2.19% over the last week.
Yes, you can track JOHNSON & JOHNSON financials in yearly and quarterly reports right on TradingView.
JOHNSON & JOHNSON is going to release the next earnings report on Jul 22, 2025. Keep track of upcoming events with our Earnings Calendar.
JNJ earnings for the last quarter are 11.54 K COP per share, whereas the estimation was 10.75 K COP resulting in a 7.33% surprise. The estimated earnings for the next quarter are 11.39 K COP per share. See more details about JOHNSON & JOHNSON earnings.
JOHNSON & JOHNSON revenue for the last quarter amounts to 91.22 T COP, despite the estimated figure of 89.83 T COP. In the next quarter, revenue is expected to reach 97.19 T COP.
JNJ net income for the last quarter is 45.83 T COP, while the quarter before that showed 15.11 T COP of net income which accounts for 203.21% change. Track more JOHNSON & JOHNSON financial stats to get the full picture.
Yes, JNJ dividends are paid quarterly. The last dividend per share was 5.08 K COP. As of today, Dividend Yield (TTM)% is 3.22%. Tracking JOHNSON & JOHNSON dividends might help you take more informed decisions.
JOHNSON & JOHNSON dividend yield was 3.40% in 2024, and payout ratio reached 84.80%. The year before the numbers were 3.00% and 84.93% correspondingly. See high-dividend stocks and find more opportunities for your portfolio.
As of May 11, 2025, the company has 138.1 K employees. See our rating of the largest employees — is JOHNSON & JOHNSON on this list?
EBITDA measures a company's operating performance, its growth signifies an improvement in the efficiency of a company. JOHNSON & JOHNSON EBITDA is 119.10 T COP, and current EBITDA margin is 31.71%. See more stats in JOHNSON & JOHNSON financial statements.
Like other stocks, JNJ shares are traded on stock exchanges, e.g. Nasdaq, Nyse, Euronext, and the easiest way to buy them is through an online stock broker. To do this, you need to open an account and follow a broker's procedures, then start trading. You can trade JOHNSON & JOHNSON stock right from TradingView charts — choose your broker and connect to your account.
Investing in stocks requires a comprehensive research: you should carefully study all the available data, e.g. company's financials, related news, and its technical analysis. So JOHNSON & JOHNSON technincal analysis shows the buy rating today, and its 1 week rating is buy. Since market conditions are prone to changes, it's worth looking a bit further into the future — according to the 1 month rating JOHNSON & JOHNSON stock shows the buy signal. See more of JOHNSON & JOHNSON technicals for a more comprehensive analysis.
If you're still not sure, try looking for inspiration in our curated watchlists.
If you're still not sure, try looking for inspiration in our curated watchlists.