IWM: ShortRussell 2000 ETF | 15-Min Chart | May 8, 2025
🚨 0.5–0.618 Fib Retracement Completed
Price has tapped into a key Fibonacci confluence zone (0.5–0.618), overlapping with previous CHoCH and unmitigated supply. This zone has historically triggered distribution phases on lower timeframes.
🔻 Technical Setup:
Price rejected from 198.4–198.7 zone
CHoCH and EQH levels form a liquidity trap above
Targeting demand near 193.78 (Fib extension 1.382 + historical support)
📊 Macro Context:
US Q1 GDP: -0.3% (contraction)
Core Inflation: Still sticky at 2.6%
Jobs Market: Strong, 177K added in April
Fed Today: Likely no cut, but any hawkish Powell tone could trigger a sharp risk-off move, benefiting this short bias.
🎯 Trade Idea:
Bias: Bearish
Entry: 198.35–198.70 (current level)
TP1: 197.43
TP2: 193.78
Invalidation: Break & hold above 199.50
⚠️ Wait for Powell @ 2:30 PM ET before scaling in. Volatility will spike.
#IWM #Russell2000 #Fed #SmartMoneyConcepts #Fibonacci #MacroTrading #LuxAlgo #RiskOff
IWM trade ideas

IWM: 1Hr UpdateIWM is showing signs of short-term exhaustion after rejecting near $198. A break of the rising trendline suggests a pullback is in play. The $187.99 level is key support – a bounce here could trigger the next leg up toward $200.68.
🧠 Trade Idea: Monitor price action near $188 for long entries targeting $200. Stop below $186.
⚠️ Bearish confirmation only if we lose $187 decisively.
🔍 Probability Setup:
🔸 Bullish Bounce → 65%
🔸 Direct Breakout → 15%
🔸 Breakdown → 20%
📅 May 1, 2025
#IWM #Russell2000 #TradingView #TechnicalAnalysis #ETF

IWM: Trade PlanTechnical Analysis:
Rising Wedge formation clearly visible on the 15-min chart, typically a bearish reversal pattern.
Major horizontal resistance at $200.78 — a strong previous breakdown level, now acting as a supply zone.
Plan: Short near $200.78 with stop-loss slightly above the upper wedge boundary (~$202-203).
Target Zones:
First target: ~$190
Second target: ~$185 if momentum increases.
Momentum indicators (RSI, MACD) are beginning to show early signs of bearish divergence — momentum fading while price grinds higher.
Fundamental Context (April 28, 2025):
Macro Risk:
Small-caps (Russell 2000) under pressure as investors anticipate a potential slowdown in U.S. GDP growth Q2 2025.
Treasury yields remain elevated → Higher financing costs disproportionately hurt smaller companies (Russell 2000 heavily debt-sensitive).
Earnings Season:
Mixed earnings for small and mid-cap companies; many struggling to beat analyst expectations.
Federal Reserve Outlook:
Futures pricing only a ~12% probability of a rate cut at the May FOMC meeting (CME FedWatch Tool, 2025).
"Higher for longer" interest rate environment is a headwind for IWM.
Market Sentiment:
Risk appetite cooling as VIX (volatility index) starts ticking up from multi-month lows.
Summary:
IWM faces a confluence of technical resistance, a bearish chart pattern, and growing fundamental pressure. Watching closely for rejection at $200.78 to initiate a short position with a measured risk/reward setup.
Hashtags:
#IWM #Russell2000 #TechnicalAnalysis #TradingSetup #ShortSetup #BearishWedge #SmallCaps #StockMarket2025 #MacroAnalysis

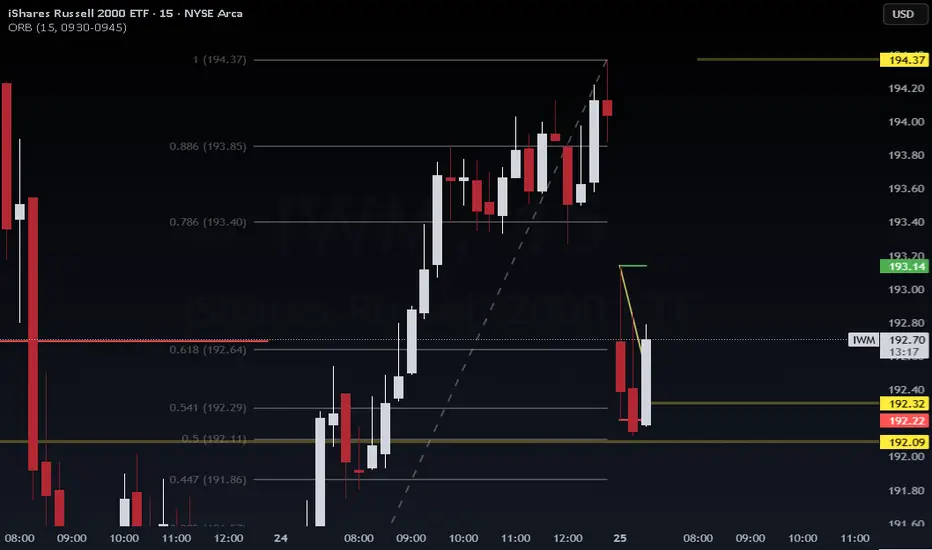
IWM: Short SetupPublished by Wavervanir_International_LLC | May 1, 2025
Thesis: Short-term weakness is emerging on the iShares Russell 2000 ETF ( AMEX:IWM ) as momentum fades following a steep vertical rally. A breakdown below the mid-band could trigger further downside into key support zones.
🔍 Technical Breakdown
Chart: 15-minute timeframe
Trend: Bearish short-term momentum
Key Levels:
Resistance: $195.64 (session high)
Mid-range Support: $194.45 (VWAP/mid-band)
Critical Demand Zone: $192.87
Indicators:
Price has pierced the upper Bollinger band and is now retreating toward the midline.
Strong rejection candle formed at the recent high, signaling buyer exhaustion.
Visual downward projection aligns with the VWAP deviation bands, reinforcing mean reversion expectations.
🧠 Probability Outlook
Bearish Continuation: 65% probability
Trigger: Break and close below $194.45
Sideways Consolidation: 25% probability
Trigger: Price holds above VWAP zone
Bullish Reversal: 10% probability
Trigger: Break back above $195.64 with volume
🔧 Strategy
Short bias favored with target at $192.87
Stop-loss: Above $195.80
Watch for increased volatility near macro catalysts (e.g., Fed rate decisions)
🧭 Stay disciplined. We trade probabilities, not certainties.
💬 Drop your thoughts and setups below 👇
#IWM #Russell2000 #DayTrading #TechnicalAnalysis #BollingerBands #MeanReversion #StockMarket #ETF #WavervanirDSS #MarketOutlook #QuantitativeTrading

US Small Companies Index ‘Russell 2000’ in Critical Trend!US Small Companies Index ‘Russell 2000’ in Critical Trend!
Let's take a look from a Fundamental and Technical perspective;
In 2020, the middle band (main trend line) of the logarithmic rising channel was broken and the upward movement had continued since then. Today, however, the same critical support level is being tested again.
If it cannot hold at this level, a long-term trend break may occur. This would significantly increase the risk perception in Russell 2000 companies.
What is Russell 2000?
It does not include large technology giants such as Nasdaq or S&P 500, but small and medium-sized companies that hold the real pulse of the US economy.
These companies are more fragile and more vulnerable to economic fluctuations.
The spread of anti-Trump protests shows that small businesses are starting to be affected both physically and economically.
The prospect of no interest rate cut by the Federal Reserve (FED) is crushing these companies under high borrowing costs.
The contraction in consumer spending can directly hit the profits of these companies because they are dependent on the domestic market.
Possible Scenarios for This Week:
🔴 If the protests deepen and the market panics:
If a break below $180 comes, the $170 support level is tested.
With panic sales, the $150 - $160 region, which is the lower band of the channel, may come to the agenda.
🟢If the environment calms down and economic data signals a recovery:
Strong purchases come from the middle trend line.
$200 - $210 band can be targeted.
In short, support is now being tested, if it breaks, the risk of serious decline is on the table.

Market Update - 4/27/2025Solid follow through, breadth has improved, a lot of breakouts this week, but I would be curious how we'll behave as we get closer to the 50dma on the indexes.
Until my market timing model shows a buy signal, I'm not gonna get aggressive, I'm still 50% invested and looking to take profits into strength, rather than entering new positions.
I'm still relatively flat for the last 2 months in my equity curve.
One thing I really need to improve is my risk management, especially around EPs. I need to reduce outsized losses (1% of my account) of which I had even 2 this month so far. And in general I am not that good with EPs, I need to study them closer.

SPY/QQQ ES/NQ 25 De Abril 2025QQQ Pre-Market Analysis – April 25, 2025
General Context:
The chart integrates SpotGamma levels, option walls, and potential reaction zones. It's designed to anticipate long trade setups based on call/put walls and retracement zones.
🔑 Key Zones and Levels
Zone/Level Description
464 – 465 (Put/Call Walls) Strong support zone, ideal for potential long setups (Buy Zone).
467.35 – RB Bottom First key resistance zone or target if price bounces from support.
469.51 – RB Head Second target/resistance based on call wall and options positioning.
471.59 – 470 (Call Wall) Final upside target. Possible reversal zone or strong supply zone.
🧠 Trade Ideas (Long Bias)
Scenario 1 – Early Bounce:
Entry Zone: Between 464 – 465
Target 1: 467.35 (RB Bottom)
Target 2: 469.51 (RB Head)
Target 3: 471.59
Scenario 2 – Retest Before Breakout:
Price may retest the Put Wall (2) at 464 before pushing higher.
This gives another buying opportunity with confirmation from price action.
Scenario 3 – Mid-range Consolidation:
Watch the 467.35 level for a breakout/rejection.
Above 467.35 with volume → bullish continuation toward 470–471.
⚠️ Critical Notes
Vol Trigger @ 466: This is a pivot level. Holding above suggests bullish bias; below = caution.
Zero Gamma Level @ 466: Another critical inflection point—watch reactions here closely.

The Ghost of 1986-1987 Stock Market Overlay onto $IWMThe 1986-1987 stock market advance was 48% as measured by the S&P500 Index SP:SPX from the low in late 1986 which peaked in August 1987 and crashed into October 19th's spectacular 20% decline in one day.
The advance in the Russell 2000 Index from the low in 2023 to the high in 2024 was 51%, topping the 48% gain in the SP:SPX and the meltdown wasn't as spectacular, but it was similar.
There were similar patterns in fears of trade wars, US dollar declines, new tax laws going into effect back then and tax laws sunsetting this time. Those you can go into by reviewing my other charts I have published over the years here.
I stretched the 1987 pattern to fit the low to the high, so it isn't "exactly" the same time day-to-day for this pattern.
I found it interesting because the chart of AMEX:IWM all by itself had the same "look" to me as the 1987 bull market and crash so I decided to put it together for you all here to see.
I would expect a choppy market from here on as people adjust to the new uncertainties. Sellers of this decline will be shy to reinvest anytime soon and buyers are likely afraid to step up and get aggressive with so much uncertainty.
Sentiment as measured by AAII shows an extremely fearful and reluctant investor class, which is typical to see at major market bottoms.
Wishing everyone peace and prosperity!
Tim West
11:17AM EST April 24, 2025

IWM Has Bottomed but Not Ready Yet for Trend ShiftWhat Price Action Says:
After a sharp decline, IWM has experienced a 15% rebound, signaling the end of the bearish trend. However, this doesn't mean the market is ready to shift upward just yet.
For now, the most probable scenario is sideways movement, likely continuing through the end of Q2. A sustained upward move will require confirmation of a clear bottoming process, which has not been seen at this stage.
Key levels to watch are support at 185 and resistance at 200. Until we see more confirmation of a stable base, expect the market to remain in a consolidation phase.

$IWM - Recap of Last Week April 14-17
Last week we had a shortened Trading week because of Good Friday.
We opened last week on Monday with a gap up right into the bear gap and got pushed out. From there we dropped down to the 35EMA and bounce there to just underneath that bear gap again.
Tuesday tried to get further into that gap and got pushed out again.
Wednesday and Thursday we regrouped and stayed close to the 35EMA which is still underneath the downward facing 30min 200. We did drop underneath that 35EMA on Wednesday when Jerome powell spoke and then reclaimed it on Friday!!
So Last week can be summed up in small caps as we got pushed out of Trumps Week gap from the week before and consolidated back to the 35EMA

$IWM - Recap of Last Week April 14-17
Last week we had a shortened Trading week because of Good Friday.
We opened last week on Monday with a gap up right into the bear gap and got pushed out. From there we dropped down to the 35EMA and bounce there to just underneath that bear gap again.
Tuesday tried to get further into that gap and got pushed out again.
Wednesday and Thursday we regrouped and stayed close to the 35EMA which is still underneath the downward facing 30min 200.
So Last week can be summed up in small caps as we got pushed out of the interest rate gap from the week before and consolidated back to the 35EMA

Market Update - 4/20/2025Breadth improving, a lot of stocks are starting to set up, there were even a few breakouts last week which is all constructive. Metals and miners are still leading, as well as defense names. NASDAQ:MVST is looking the best, have a good sized position in it, let's see how it evolves next week. I still remain defensive though, only 3 positions.


IWM Trapped at Key Gamma Pivot! GEX Squeeze or Breakdown ?🔮 GEX (Gamma Exposure) – Options Sentiment Overview
🚨 High-Risk Gamma Pivot Around 186–185.8
* IWM is sitting exactly on its highest negative NET GEX zone at 185.82, making this a key inflection point.
* Dealers are likely long gamma here — a break below can force rapid adjustments, pushing the ETF toward 183–182, where more negative GEX builds.
🔺 Dense CALL Walls at 187–190–192
* There’s strong CALL resistance stacked between 187.94 and 192.12, with 190 and 192 showing large hedging flow.
* Any upside attempt will likely stall into these zones without strong volume or macro support.
📊 GEX Sentiment Breakdown:
* IVR: 43.3 → Moderately elevated, volatility potential remains.
* IVx avg: 34.8, currently down –14.73%, signals a possible volatility contraction, which could hurt premium buyers and favor a grind or drop.
* PUTS: 53% → Extremely heavy PUT positioning, indicating dealers are short gamma to the downside and could fuel accelerated selloffs if 185 fails.
🎯 GEX Flow Summary:
* If 186 holds, expect more chop between 186–188.
* If 185.8 breaks, price could snap toward 183 → 182 → 180, where next levels of PUT walls await.
🕰️ Technical Analysis – 1 Hour Chart Breakdown
Price Structure:
* Price is tightly coiled at the apex of a descending triangle.
* Support is showing stress at 184.97–185.8, with lower highs forming — this looks bearish unless bulls reclaim the wedge.
Indicator Confirmation:
* MACD: Flat and neutral, no bullish crossover in sight.
* RSI: Grinding lower under 50, consistent with bear pressure building.
Levels to Watch:
* Support: 185.8 → 183 → 182 → 180
* Resistance: 187.9 → 190 → 192.1
🧠 Final Thoughts:
IWM is caught at a crucial gamma pivot with both sides hedged and waiting. Dealers are loaded with PUTs — if this slips under 185.8, we could see amplified selling toward 182 or even lower. However, if bulls reclaim 187.5 and flip VWAP, then 190 becomes possible.
This is a gamma squeeze waiting for a trigger — prepare for volatility.
This analysis is for educational purposes only and does not constitute financial advice. Always use proper risk management and let price confirm your bias.

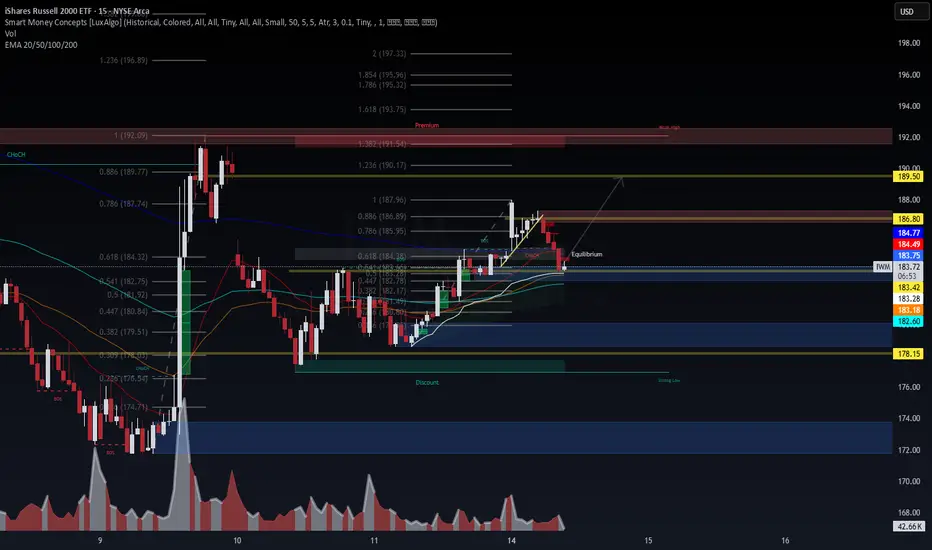
IWM: Potential Trade Setup📊 IWM – Smart Money Playbook in Action
🔹 15-min chart | April 14, 2025
This IWM chart shows a clear sequence of liquidity grabs and structural shifts aligned with Smart Money Concepts (SMC). Here's a breakdown of the key moves and what I'm watching next:
🔍 Key Observations:
Break of Structure (BOS) and Change of Character (ChoCH) confirm bullish intent early on.
Price retraced to a discount zone (below 0.5 Fib) and formed a strong base near $176.54–$178.15.
The rally respected the 0.618 Fib retracement ($184.32), aligning with the equilibrium zone, where price is currently consolidating.
📈 Bullish Bias:
We’ve seen a clean mitigation of the OB before the digging candle pushed into premium pricing.
Price is now in the mid-range (EQ) between discount and premium. If bulls hold above $182.75, we could see a continuation toward the next liquidity levels.
Next targets:
🔸 $186.80 (minor supply zone)
🔸 $189.50 (weekly inefficiency + liquidity)
🔸 Extended projection: $192–$193.75 (Premium + 1.618 extension)
📉 Downside Risk:
A breakdown below $182.60 would invalidate this structure and shift focus to the deeper OB zone around $178.15.
📌 Trade Setup Idea:
Entry: Above $183.00 retest with confirmation (PA or OB mitigation)
Stop: Below $182.00
Target 1: $186.80
Target 2: $189.50
Target 3: $192.09 (old high)
⚠️ Watch volume reaction around EQ and VWAP crossovers.
💡 SMC, Fibonacci, and EMA confluence at play – let price show its hand before committing.
📈 Volume confirms intent – we just follow structure and flow.
#IWM #SmartMoneyConcepts #VolumeAnalysis #LiquiditySweep #OptionsFlow #FibRetracement #TradingView #TechnicalAnalysis #Wavervanir
IWM CIWM and the overall market are in a decent uptrend coming off crazy lows. with trump coming out with news every minute this makes swinging calls risky but i feel like i don't wanna pass up this opportunity. so I'm gonna buy IWM $200Cs for may 16 i would be taking partial profits just below those trend lines. i would have a sell for a loss if a daily candle close outside the channel
if u want low risk you could do it based of the 2H candle


$IWM Boom From the Bottom to the Top of the Implied MoveWe used the entire trading range
Alright - Yesterday - We stayed completely with in the implied move - you can see that both sides got tested which gave us some wild swings. Spreads on both ends paid. 10% intraday moves
We hit the bottom of the implied move, the top of the implied move and we saw resistance at the 35EMA.

Quantum's IWM Trading Guide 4/8/25IWM (iShares Russell 2000 ETF) - Sector: Broad Small-Cap ETF (Russell 2000)
Sentiment:
--Bearish (softening). Pre-market put volume eased, RSI 44 up from 42, X posts overnight hint at an oversold bounce despite tariff fears, suggesting a less dire tone.
Tariff Impact:
--Moderate. Industrials/financials exposure persists.
News/Catalysts:
--Consumer Credit (April 8) could spark a relief rally if strong; X posts on tariff delays offer faint hope, though bearish bias lingers.
Technical Setup
-Weekly Chart:
---HVN above as resistance, weekly low as support.
---Downtrend (8-week EMA < 13-week < 48-week).
---RSI 44 (less weak), MACD below signal (histogram narrowing)
---Bollinger Bands near lower band,
---Donchian Channels below midline,
---Williams %R -70 (easing from -74).
-One-Hour Chart:
---Support at yesterday’s low, resistance at midday high, weekly confluence.
---RSI 42 (up from 40),
---MACD below signal (histogram less negative),
---Bollinger Bands near lower band,
---Donchian Channels below midline,
---Williams %R -72 (up from -76).
-10-Minute Chart:
---Pre-market bounce attempt, 8/13/48 EMAs flat (less steep),
---RSI 42 (up from 38),
---MACD flat near zero.
Options Data:
---GEX: Bearish (softening)—pinning pressure eased slightly overnight.
---DEX: Bearish (softening)—put delta leads but less aggressively.
---IV: Moderate—25–30% vs. 20–25% norm, steady volatility.
---OI: Put-heavy—high OI below close persists.
---Directional Bias: Bearish (softening). GEX’s reduced pinning suggests less dealer-driven downside, DEX’s put delta bias weakens, moderate IV supports some volatility but not extreme moves, and put-heavy OI anchors prices lower—still bearish but with less conviction.
Sympathy Plays:
--TNA (Direxion Small Cap Bull 3X): Falls 3x if IWM dumps, rises if IWM rebounds.
--TZA (Direxion Small Cap Bear 3X): Gains if IWM dumps, fades if IWM rallies.
--Opposite Mover: IWM dumps → TZA rallies; IWM rallies → TNA surges.
Sector Positioning with RRG:
--Sector: Broad Small-Cap ETF (Russell 2000).
--RRG Position: Lagging Quadrant. Tariff/rate drag persists.
Top 5 Movers (Russell 2000): SMCI (+2%), MARA (+1.5%), RIOT (+1%), CVNA (+0.8%), PLUG (+0.5%).
Bottom 5 Movers (Russell 2000): AMC (-3.5%), RKT (-3%), UPWK (-2.5%), ZETA (-2%), RUN (-1.8%).

$IWM Recap of Historic Drawdown WeekA historic week with unprecedented tariffs not seen since right before the great depression.
We broke many supports and are looking for Support
Stay Tuned - Today's Trading Range is coming out.
Don't rush into a trader just to trade - But also, if you see a great opportunity take it.

Quantum's Premium IWM Weekly OutlookSentiment
Overall Sentiment: Bearish with potential for reversal.
Options Activity: Recent data shows elevated put volume over calls (e.g., 8 puts Ascending Triangle DEX suggests a bearish directional bias. Posts on X indicate traders are eyeing short setups, reinforcing this sentiment.
1 OTM Premiums:
0DTE (April 7 expiration):
Call: $182 strike, premium $1.20 (moderate IV, ~35%).
Put: $180 strike, premium $1.35 (moderate IV, ~35%).
Weekly (April 11 expiration):
Call: $182 strike, premium $1.45 (moderate IV, ~32%).
Put: $180 strike, premium $1.40 (moderate IV, ~32%).
Notes: Premiums are kept under $1.50 for cost efficiency in 0DTE and weekly trades. IV levels are moderate, reflecting recent volatility spikes but not extreme conditions, making these contracts attractive for short-term plays.
Technical Indicators:
Weekly EMAs (8/13/48): The 8-week EMA ($198.50) is below the 13-week ($202.10) and 48-week ($208.30), confirming a downtrend.
RSI (14-week): 32, nearing oversold territory, hinting at a possible bounce.
Market Context: Small-cap stocks like IWM have been under pressure due to tariff fears and a hawkish Fed stance. However, oversold conditions and seasonal strength in April could signal a relief rally.
Potential: Continuation of the downtrend is likely unless a catalyst reverses sentiment, but a short-term bounce to $185–$190 is plausible given oversold readings.
Tariff Impact
Exposure: Moderate to severe.
Analysis: IWM tracks the Russell 2000, comprising small-cap U.S. companies, many of which are domestically focused (e.g., manufacturing, retail). A 10% universal tariff, 25% on Canada/Mexico, or 46% on Vietnam could raise input costs for these firms, squeezing margins. Sectors like industrials (20% of IWM) and consumer discretionary (15%) are particularly vulnerable. However, tariff impact may be overstated—rising interest rates and a strong dollar are likely stronger drivers of recent weakness. Critically, the narrative around tariffs often amplifies fear beyond fundamentals, offering contrarian opportunities if panic subsides.
News/Catalysts
Recent News: Trump’s tariff rhetoric intensified last week, with small-caps hit hardest (IWM down 9.5% in 1M). The Fed’s hawkish December stance continues to weigh on risk assets.
Upcoming Events:
April 8: Consumer Credit data release—could signal consumer health, critical for small-cap earnings.
Mid-week: Potential tariff policy updates—speculative but impactful.
Speculative Catalysts: X posts highlight short interest in IWM and oversold conditions, suggesting a squeeze potential. A surprise Fed pivot or tariff rollback could spark a massive rally.
Alignment: Small-caps are sensitive to economic data and policy shifts, making IWM a prime candidate for volatility-driven moves.
Technical Setup
Weekly Chart:
Key Levels:
High Volume Node (HVN): $195–$199 (prior support, now resistance).
Monthly Open: $199.78 (resistance).
Weekly Low: $176.67 (support).
Trend: Downtrend since March peak ($208.52), testing year-lows.
One-Hour Chart:
Support: $179–$180 (confluence with weekly low).
Resistance: $182.50–$184 (prior consolidation zone).
10-Minute Chart:
Entry/Exit:
Bullish: Break above $181.50 (8-EMA) with a hammer candle for a long to $183.
Bearish: Breakdown below $180 with volume for a short to $177.
EMAs (8/13/48): 8 ($181.20) > 13 ($181.00) < 48 ($182.30)—choppy, no clear trend intraday.
Indicators:
RSI (14): 38 (10-min), neutral but rising—watch for divergence.
MACD: Near zero line, flat—momentum stalling.
Options Data Weekly Overview
Gamma Exposure (GEX): Bearish—pinning near $180–$182, dealers hedging accelerates downside below $180.
Delta Exposure (DEX): Bearish—put-heavy activity signals directional selling.
Vega Exposure (VEX): Neutral—moderate volatility potential, no extreme IV spike expected.
Implied Volatility (IV): Moderate (~32–35%)—elevated but manageable, favoring sellers over buyers.
Open Interest (OI): Bearish—high OI at $180 put and $185 call strikes, capping upside.
Potential Price Targets
Bullish: $185 (+2.2%)—tests weekly HVN; $190 (+5%) if momentum builds.
Bearish: $177 (-2.3%)—revisits year-low; $170 (-6.2%) on tariff escalation.
Trade Idea
Bullish 0DTE (April 7):
Trade: Buy $182 Call @ $1.20.
Entry: Break above $181.50.
Target: $183 (profit $0.80, +66%).
Stop: $180.50 (loss $0.70, -58%).
Bearish 0DTE (April 7):
Trade: Buy $180 Put @ $1.35.
Entry: Breakdown below $180.
Target: $178 (profit $0.65, +48%).
Stop: $181 (loss $0.85, -63%).

Market Update - 4/6/2025Was contemplating selling some puts to bet on a rebound next week given how oversold we are on all measures, but decided to pass. We are in uncharted territory and you never know how steep these markets can fall before they find support. After all, I'm not in the falling knife catching business.
As for my active account, I only had a few small trades booking a small loss for the week. Still flat for the past month. Overall likely cash will continue to be king for a while. I'm always on the lookout for high RS names though, but now things are extremely shaky to be buying breakouts.
