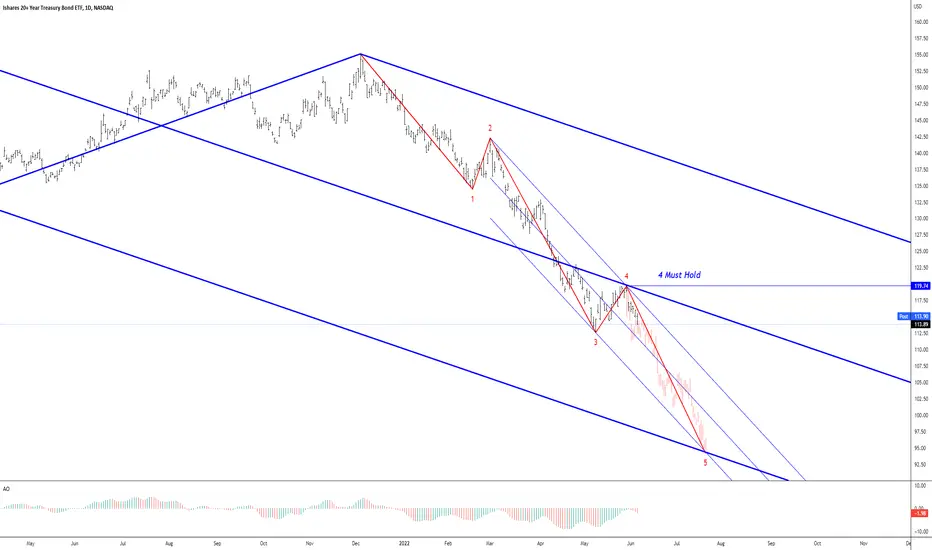
TLT - Another Month of Wreckage 7/7 Due007s who bought the dip...
Ripped.
It's now a comedy and further evidence...
Throwing Capital into a toxic cesspool does not produce
a Hulk, Spiderman, or Marvel Character who defies the laws
of common sense.
Buy this Chart and LOSE.
TLT trade ideas

SPY, BONDS & FED BALANCE-SHEET - (zoomed)A place to view T-Yields, Fed Funds, and Money Supply against TLT and the SP500 .

SPY, BONDS & FED BALANCE-SHEETA place to view T-Yields, Fed Funds, and Money Supply against TLT and the SP500.

$TLT ~ Lower lows as expected...We was looking for a 5th wave and it appears we are getting it. Once 61.8 is reached, will need to monitor to see if it holds or we continue pushing lower to the 78.6. Seems there are few safe assets these days as liquidity is drying up.

TLT dangerously close to 2008 supportNASDAQ:TLT not looking to HOT here. The federal reserve has the following 3 options:
1) Stick to 0.50 basis points and continue the slow bleed. ~ This will piss off investors with cash on the sidelines and will most like hit the market harder.
2) Get aggressive and raise 0.75-1 basis point ~ Market may react positively. This would show the federal reserve is "serious" on fighting inflation.
3) Take the foot off the accelerator and step back into the market. Using macro environment as an excuse, for example Russia invasion of Ukraine and China lockdowns.
I think it is noteworthy to mention that China has lowered their interest rates and are outperforming US equities. It honestly looks way more attractive and this is something the fed will have to ponder. This is a lose/lose battle because the federal reserve cannot magically print supply.

pop, pop, fizz, fizz-- no more yield curve inversioni think this is headed for a terminal thrust or wave 5, and abc will correct on some support in the given lower ranges TLT. after seein all time highs, i believe the 10 year will fade if it enters weekly consolidation, and fails some break out level forming a false breakout of upper 90% range. TLT is on watch for bullish divergence macd, stoch, rsi monthly

Long TLT at 116.03www.tradingview.com
At a strong support level, buying TLT with a larger position of 5% here for all of the reasons circled in my chart, as well as the fundamentals that made the technicals possible.
Seeing what happened following the great financial crisis, 2016 and during covid in 2020, we can see a major run up in the TLT. Expecting the same over the medium term.
Also, RSI and MACD levels show support for buying.

Will Superman (Powell) Return" No maybe in 2023Well well well here we are again now that your fake heroes have finally given up on calling inflation transitory which even a a circus monkey to tell you that wasn't going to happen we Can begin with the bloodbath. Well not here necessarily that will begin with the S&P 500 it will make sense soon enough. I will start with my condolences for those retirees with their 60/30 getting hammered both ways for those doing good keep it going baby. The boys at FED just started removing money from the markets this the beginning of more quantitative tightening measures to come. Anyone believing that this can hold if it goes to 130 it's just pure fractional wrongness while we are oversold The FED is no longer buying therefore no reason for this to make a turnaround we have been on a downturn since March 9th 2020 and people would rather risk money on the market than to buy these bonds even if the S&P were to capitulate to 3500 YES I know 600 points that's what happens when markets are flooded with cheap money. My best case scenario is bonds go 5-8% up I have a range of put options with expiration's in August September and some in January 2023. But I'm a cheapskate so I'm waiting for those puts to get a little cheap its in my best interest to do so.
(Remember money is made when people refuse to think that bad things can happen and they WILL This is just the beginning BABY)

$TLT ~ Expecting one more leg down then ready to run...Expecting bonds to push one more time lower as shown to complete its wave 5. Once complete may be a very interesting opportunity.

TLT Plot.Made a short idea recently with the expectation the bounce was going to be a bit higher (and that's still possible) but it's looking more like this bounce may of topped and we're going head down from here.
Traditional portfolio strategy for retirement... not so hot now!The candles below represent a 60/40 mix of TLT and SPY, bonds and stocks. SPY (orange) and TLT (blue) by comparison show than neither asset class is helping to overcome the bad performance of the other. By comparison, moving money to cash (UUP) looks like it would have been a great short-term move against inflation.

Bear Flag in Bond ETF?Bonds have been in a steady downtrend all year. And now, after a period of consolidation, the iShares 20+ Year Treasury Bond ETF may be set to continue lower.
This main pattern on this chart is the modest rebound over the last three weeks. Given the preceding four months of downside, it could be a classic bearish flag. The current drop also represents a potential break of the flag, which could bring sellers from the sidelines.
Second, notice how the stochastic oscillator recently jumped to its most overbought reading of the year.
Third is the low price of $111.90 from late 2018. Will traders look for that level as support?
Finally, macro conditions may favor downside in TLT. Yesterday brought strong U.S. consumer confidence and higher European inflation. Today featured robust manufacturing data. Non-farm payrolls are due Friday, followed by CPI on June 10 and the Federal Reserve meeting on June 15.
TradeStation has, for decades, advanced the trading industry, providing access to stocks, options, futures and cryptocurrencies. See our Overview for more.
Important Information
TradeStation Securities, Inc., TradeStation Crypto, Inc., and TradeStation Technologies, Inc. are each wholly owned subsidiaries of TradeStation Group, Inc., all operating, and providing products and services, under the TradeStation brand and trademark. You Can Trade, Inc. is also a wholly owned subsidiary of TradeStation Group, Inc., operating under its own brand and trademarks. TradeStation Crypto, Inc. offers to self-directed investors and traders cryptocurrency brokerage services. It is neither licensed with the SEC or the CFTC nor is it a Member of NFA. When applying for, or purchasing, accounts, subscriptions, products, and services, it is important that you know which company you will be dealing with. Please click here for further important information explaining what this means.
This content is for informational and educational purposes only. This is not a recommendation regarding any investment or investment strategy. Any opinions expressed herein are those of the author and do not represent the views or opinions of TradeStation or any of its affiliates.
Investing involves risks. Past performance, whether actual or indicated by historical tests of strategies, is no guarantee of future performance or success. There is a possibility that you may sustain a loss equal to or greater than your entire investment regardless of which asset class you trade (equities, options, futures, or digital assets); therefore, you should not invest or risk money that you cannot afford to lose. Before trading any asset class, first read the relevant risk disclosure statements on the Important Documents page, found here: www.tradestation.com .

watching for break of resistance 👀if we can break above 120 local resistance we could see a potential rally to 121.64-125.46-129.28

Bearish looking rising wedge on TLTThe 'breakout' of the recent down trend on TLT is looking muted and there has been a bearish rising wedge pattern forming. No breakdown as yet.

$TLT weekly on watch$TLT has seen multiple touches of the 114.30 level that have resulted in a reversal. Would keep your eyes on $TLT heading into the weekend. This Bond ETF Offers Bears An Alternative due to its inverse correlation to the SPDR S&P 500 ETF Trust (NYSE:SPY). The fund tracks a market-weighted index of debt issued by the U.S. Treasury with maturities of 20 years or more.

Rates Back Down with Growth SlowingTPs of 125 and 130 seem reasonable with massive growth deceleration coming. Maybe even ~140

TLT may return to 132-135 neutral zone as a flight to safety.TNX 10-yr yield may have peaked out as investors rotate to the safety of bonds in the 120-114
accumulation zone. TLT has completed a big M-pattern stopping at almost perfect FIBO levels. This ABC wave has already made a 300% retracement from the ATH of 173.89 made last 9Mar2020 before pandemic striked.
The 132-135 zone will be some sort of neutral area for determining inflation or deflation. It is also the neck zone of the M-pattern. As it fell quickly from this zone, the rebound will also be very fast looking at the volume profile that has a large space in between.
5 impulse waves & 3 ABC corrective waves have end this EW cycle & a new cycle shall begin as TLT returns to the baseline of my slanted FIBO CHANNEL where wave 3 had started at Feb2011.
Not trading advice

Did $TLT Finally BounceLook at the pivot finally form? It’s been a long fall but look at the change of the pivot finally forming. Anyone else see this reversal?

$TLT 15 year channelHere's another perfect long term channel. It is a log chart of $TLT. I am long $TMF (3x leveraged ETF ). No price target yet as I want to see how this whole thing plays out.


BUY TLTI've been right about most things
But wrong about bonds so far
If it doesn't respect the white fork, it has the previous swing low (marked) and the fib as protection
THIS is the buy
NOT TRADING ADVICE

TLT - 2 Hour PThe 20 Year ETF Bond has declined significantly in 2022.
Longer-term I anticipate 6% as the Primary PO for the 10 Year
Note.
TLT will head well below 100 into October 2023, breaking 92s
will provide an immediate break - an immense break.
______________________________________________________
Sub 50 is an absolute on Mid Curve to 6%.
Declining from 173.69 to 112.62 is simply the 1st in a Series of
lower lows ahead.
I do, however, anticipate a counter-trend to 2.12 to 2.26.
TLT remains the JUNK ETF, chased by the inexperienced traders
seeking safety.
Hopefully, this herd is beginning to see the Cliff ahead as the
Bond Buffalo will be run up the plains mesa to their ultimate
deaths.
132 should limit the Upside ST.

Long swing in Treasuries - yields will dropWe have seen a historically dramatic selloff, and RSI and stochastic show a great entry to buy TLT. This is a good buy for an investment account.
