F3A trade ideas

First solar is a long opportunity -target at 38 UsdStock is moving upwards in a smooth way. There is room until 38 Usd at least.
Increased volumes are associated with long white candles. This gives us more confidence about the outcome of a long strategy.
Suggested trade: LONG. Take profit at 38 Usd
Please follow us at www.wallstreetimes.com


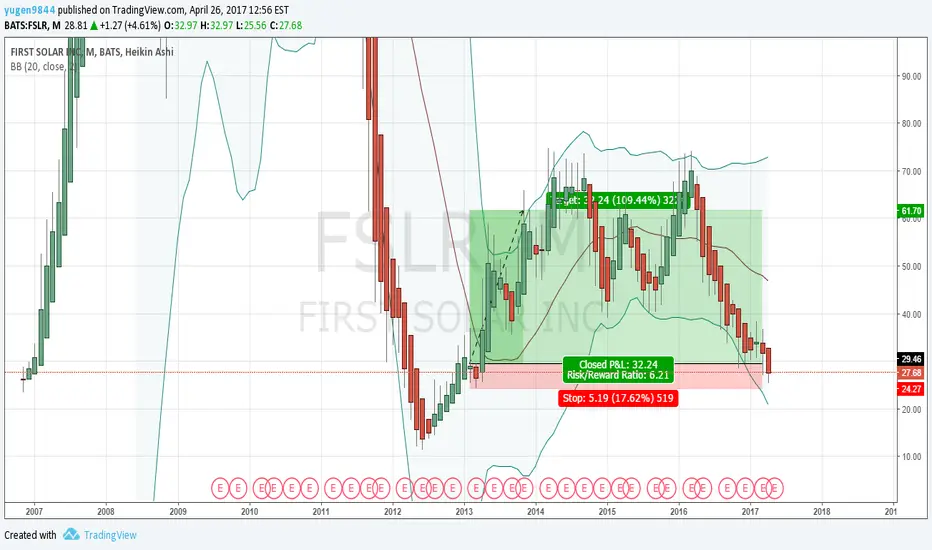
Bearish Gap Fill Pending For First SolarFirst Solar has been in a clearly defined downward trend since between May and August of 2016. As of the close on May 12, this stock is at the top of the cycle which is near a strongly established resistance. The projected future movements are highlighted below.
When we take a look at other technical indicators, the relative strength index (RSI) is at 81.4842. RSI tends to determine trends, overbought and oversold levels as well as likelihood of price swings. I personally use anything above 75 as overbought and anything under 25 as oversold. Currently the RSI is well overbought and due to retreat.
The true strength index (TSI) is currently 21.9577. The TSI determines overbought/oversold levels and/or current trend. I solely use this as an indicator of trend as overbought and oversold levels vary. The TSI is double smoothed in its calculation and is a great indicator of upward and downward movement. The current reading declares the stock has been moving up.
The positive vortex indicator (VI) is at 1.3173 and the negative is at 0.6377. When the positive level is higher than 1 and higher than the negative indicator, the overall price action is moving upward. When the negative level is higher than 1 and higher than the positive indicator, the overall price action is moving downward. Currently the positive indicator had been moving up, but may be in the early stages of its downward reversal. Projected future movement has been drawn in the VI window.
The stochastic oscillator K value is 93.9795 and D value is 90.7662. This is a cyclical oscillator that is highly accurate and can be used to identify overbought/oversold levels as well as pending reversals and short-term activity. I personally use anything above 80 as overbought and below 20 as oversold. When the K value is higher than the D value, the stock is trending up. When the D value is higher that the K value the stock is trending down. The stochastic is currently in overbought territory. This indicator will drop, the question is will the stock drop with it or slowly begin to swing up and down?
The stock recently gapped up after earnings. Gaps are typically filled, but the time in which this is done varies. Even though a closing of the gap may happen, simple movement to the bottom of the gap is much more likely and it is a staggering 11% drop from the May 12th closing price.
Considering the RSI, TSI, VI and stochastic levels, the overall direction favors a move to the downside, although definitive downward movement may take a few more days to develop. Based on historical movement compared to current levels and the current position, the stock could drop at least 10% over the next 30 trading days if not sooner.
More analysis at LimitLessLifeSkills!


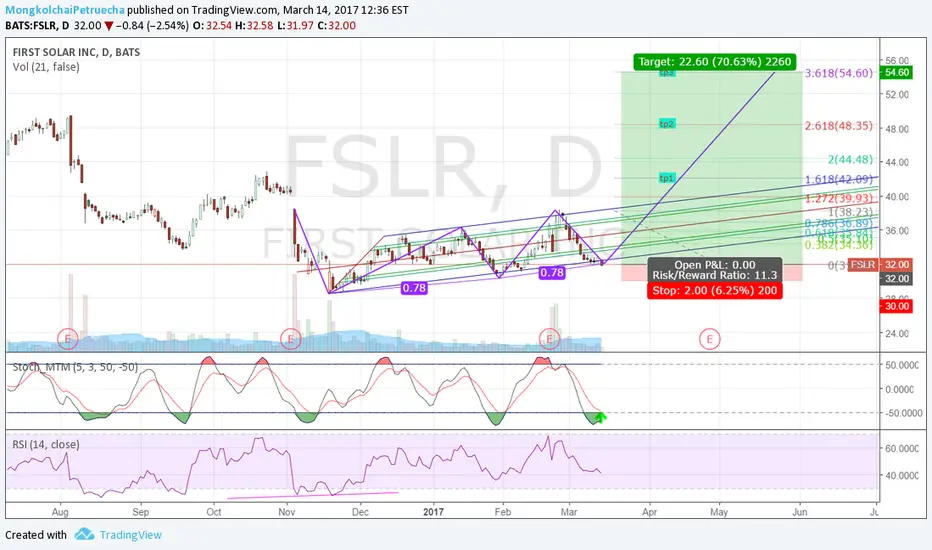
FSLR TargetsDaily MACD crossed over as of Monday (4/10/2017) with higher than normal volume. Bullish volume seems to be higher than average the past few days. Looking at the Fib Retracement line from the most recent high on February 27, 2017 to the most recent low on 4/6/2017, I believe the next short term price target is $28.72 (which is also a resistance line on the daily, +2.4x% from a possible $28 entry. Followed by $30.46 (+8.6x% at a possible entry at $28).
Although these are tentative targets, I would not hold through earnings at this point, since playing earnings exposes one’s self to undue and unforeseen risk.


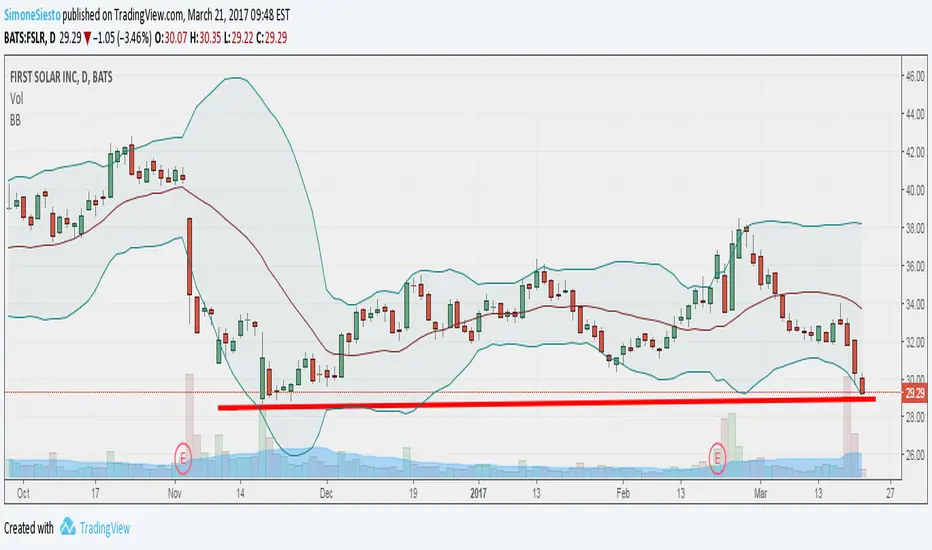
First solar is a short below the low at 28.90 USDFirst solar is a short below the low at 28.90 USD. Huge volumes have been detected on March 17. Bollinger bands are widening out, giving a good signal for a short entry. However, before triggering a short, it is suggested to wait for a break below 29 USD.