Netflix is abouve breakout level of 959.24Netflix is above breakout level of 959.24 and is is near to break trendline too. May be it will cross 1000 and 1200 levels.
Note: This is not a buy sell call. Trade at your own will, Use stop loss too.
NFLX trade ideas

No more chill... NFLX earnings 4/17I have kept an eye out on this chart for the last month. I see a head and shoulder on the Month & Week chart. If NFLX has an amazing earnings... expect a celebration. I heard a guru say that successful companies who deliver will be rewarded; which means we also can be rewarded. I have my levels marked off. Do you?
I'll post my day chart after market close Thurs and be tuned into the earnings call. If it's a win and the "macro environment" keeps NFLX down, let's track the wins for when the time comes to get that arrears.

OMNICHART presents => NFLX - long term trendNetflix is still in an upward channel - in a long term bullish trend. In the coming months if it meets the support line and bounces off then that would be the time to buy leaps or scale into additional long term positions. Or start scaling in along with a put spread/s until the support line for a year. A tweak in the trade do make additional income would be to sell put at the support line for every week or month and most likely it will expire worth less and then sell a subsequent put (for week or month) at a point higher on the support line , basically keep selling your puts on the support line as time moves along and the price is above the support line. This was you might just cover the price of the long put you bought today and even make additional income. And if the stock goes up you are still making money. This buys you additional protection for free based on how disciplined you are with managing the put spread (especially the short end of it).

Netflix (NFLX): Streaming Leader Enters Momentum ZoneNetflix, Inc. (NFLX) is a global leader in streaming entertainment, offering a vast library of TV shows, movies, documentaries, and original content to subscribers in over 190 countries. With hits like Stranger Things, The Crown, and Squid Game, Netflix continues to shape pop culture and redefine how people consume media. The company is also expanding into gaming and advertising-supported tiers to grow its user base and revenue streams. As more viewers shift from traditional cable to on-demand streaming, Netflix remains at the center of digital entertainment.
The stock chart recently found support at the 0.50 Fibonacci retracement level and closed above the 0.236 line—placing it in the momentum zone. This technical setup, backed by strong volume, signals increased buying interest and suggests the potential for a continued push higher as bullish sentiment builds around the stock.


Could Netflix (NFLX) Be Gearing Up for a Major Correction?Netflix has had an impressive bull run since mid-2022, but based on historical structure and price behavior, a correction could be right around the corner.
🔍 Chart Breakdown (9W Time Frame):
Current Price: ~$870
2025 Projected High: $1,064.50
No significant correction since 2022
Bearish Target Zones:
📉 Zone 1: ~$443 (-46% from current levels)
📉 Zone 2: ~$344 (-57% from current levels)
Market Structure Notes:
Bullish momentum has been non-stop for 2+ years
The last time Netflix saw a proper reset was during the 2022 market correction
If this candle breaks structure to the downside, the selloff may be fast and steep
Support Zones are clearly outlined between the 2023 lows and historical demand blocks
💬 My Prediction:
I believe Netflix is overdue for a pullback, and based on the volume and vertical structure of this bull run, we could be setting up for a mean reversion play back to strong support areas.
I’m not saying Netflix isn’t a long-term powerhouse, but even the strongest runners need to rest. Price doesn’t move in a straight line forever.
📌 Not Financial Advice — just technical breakdown and a probability-based setup.
🔖 Hashtags:
#Netflix #NFLX #StockMarket #CorrectionIncoming #BearishSetup #TechnicalAnalysis #CandlestickChart #InvestSmart #TradingView #StockPrediction #Watchlist

NFLX & chilling w/ putsUpdate to my chilling status on NFLX. 4/7/25 gap down, retest of a critical breakdown point for me 910.
Target 825-775 (this week or next week).
Overall mkt bearish due to Tariffs.
@ContraryTrader even left us a clue in my previous update (May/June).Thank you!
*The magic wand feature seems to be extra... & I love that. I'll get a handle on it. Until next time, shorting pops through earnings.


Bearish Setup on NFLX: Correction Wave (C) UnfoldingTF: 4h
NFLX appears bearish at the moment. The corrective structure on the 4-hour timeframe suggests a potential decline. The current formation indicates that wave B likely completed at 998.61 , and the stock has now begun its descent into wave (C) of the correction.
The correction may extend to the 100% projection of wave A at 788.67 , or potentially deepen to 659.06 , aligning with the 1.618 Fibonacci extension of wave A. After the completion of wave (C), traders can buy for the target up to wave B at 998.61 .
I will continue to update the situation as it evolves.

NETFLiX: $855 | reset for next generational gainsa FRESH BEAR is as Wicked as a Bull on Steroids
money go rounds
as this is anchored to Tariff circus
money managers who invested in the last decade are booking profits
as time for retirement to enjoy life
next batch of retirees should be lucky to wait at $300 zone to hop on
markets are cycles and this one
gives the best bang for every buck both long and short players
just size in entries as this can wick you out both ways


If you fail, fail fast and learn from it. Lessons learned from my mistakes.
Rule 1: Dont lose money.
Rule 2: Never forget rule 1. Warren Buffett.
Rule 3: The market is always right.
Rule 4: The trend is your friend.
Rule 5: Dont fight the trend.
Rule 6: Figure out your method of trading and stick with it.
Rule 7: Ignore the noise. Ignore the news. Ignore the narrative. The charts are EVERYTHING!
Rule 8: Understand pattern recognition, have factors, find support and resistance.
Rule 9: Dont be fooled by lies and deception.
Rule 10: Never forget Rule #1 :)

Netflix Wave Analysis – 25 March 2025Netflix Wave Analysis – 25 March 2025
- Netflix broke resistance zone
- Likely to rise to resistance level 1050.00
Netflix recently broke the resistance zone located between the resistance level 960,00 (former support from February), resistance trendline of the daily down channel from February and the 50% Fibonacci correction of the downward wave 2 from last month.
The breakout of this resistance zone accelerated the active intermediate impulse wave (3).
Given the clear daily uptrend, Netflix can be expected to rise to the next resistance level 1050.00, target price for the completion of the active impulse wave (3).


NFLX eyes on $860-ish: Major Fib Cluster and Key Support to holdNFLX dropping rapidly along with the market wide pullback.
It has just hit a major fib cluster at the $859.07-865.73 zone.
If this zone fails then look lower at the $811.19-814.75 zone.
Previous Analysis that gave several entries:
========================================================
.

Netflix Gap Filled: Will the Channel Hold ?👋 What’s up, traders! Netflix is at a critical support zone—what’s your take on this setup?
🚀 Hope everyone’s having a great trading day! Here’s an interesting technical setup on NFLX. Let’s break it down together!
Netflix (NFLX) has been trading inside a well-defined ascending channel, respecting both channel resistance (upper boundary) and channel support (lower boundary). Recently, the stock experienced a sharp sell-off, leading to the completion of a major gap fill, highlighted in blue.
Historically, gap fills often act as key decision points, where price either reverses or breaks down further. Now, NFLX is testing a critical support zone at the lower boundary of the channel.
Why is this level important-:
The gap is now fully closed, removing the imbalance created by the previous breakout.
The ascending channel support is holding for now, making it a key zone for buyers.
If buyers step in, a bounce could follow, while a break below this level may lead to further downside.
Key Observations & Market Psychology-:
Gap Fill Completed: The price has fully retraced the previous breakout gap—this is often a point where traders react.
Strong Bearish Momentum: The recent decline was aggressive, showing significant selling pressure.
Volume Analysis: If buying volume increases at this level, it could indicate a potential reversal. Conversely, heavy selling volume may confirm further downside.
Confluence Factor: This support aligns with previous price action, making it a high-probability zone for a reaction. Let's discuss trading plans according to above obsevations.
Bullish Scenario (Bounce from Support)-:
If the price respects the channel support and forms a bullish reversal candlestick pattern, such as a hammer or bullish engulfing, this could trigger a bounce.
A move above $920 - $940 would indicate strength, with targets at $970 - $1,000.
A break above $1,000+ could lead to a continuation toward the channel resistance around $1,050.
Bearish Breakdown (Failure of Support)-:
If NFLX breaks below the ascending channel support with strong volume, further downside could be expected.
The next key support zone would be around $840 - $800, where buyers might step in again.
Increased selling pressure could accelerate the decline, making short positions favorable.
Educational Insight: Why Do Gap Fills Matter?
Gaps occur when price jumps between two trading sessions without any activity in between. These gaps often act as magnets, as price tends to revisit them before deciding the next trend.
Why does this happen?
Gaps represent areas of low liquidity that markets often seek to fill.
Once a gap is filled, the price either reverses strongly or continues in the direction of the trend.
Final Thoughts & Trade Approach
Netflix (NFLX) is currently at a make-or-break level, and the next few trading sessions will determine it's direction.
If buyers step in, this could be an excellent long opportunity.
If sellers push it lower, the breakdown could open doors for further downside.
What’s your take on NFLX? Will it bounce or break down? Let’s discuss in the comments!
Hope you will like the publication
Best Regards- Amit


Elliott Wave View: Netflix (NFLX) Resumes Rally After 3 Waves CoShort term outlook in Netflix (NFLX) suggests that the ETF has ended wave IV at 853.68. Decline from 2.18.2025 high is in progress as a zigzag Elliott Wave structure. Down from 2.18.2025 high, wave ((A)) ended at 955 and wave ((B)) ended at 1000.89. Wave ((C)) lower unfolded in 5 waves impulse structure. Down from wave ((B)), wave (1) ended at 958.17 and wave (2) ended at 995.6. Wave (3) lower ended at 858.11 and wave (4) rally ended at 896.9. Final leg wave (5) ended at 853.6 which completed wave ((C)) of IV.
The stock has resumed higher in wave V, but it still needs to break above 2.18.2025 high at 1065.05 to rule out a double correction. Up from wave IV, wave (1) ended at 927.18 and wave (2) pullback ended at 887.5. The stock has resumed higher in wave (3). Up from wave (2), wave 1 ended at 917.2 and pullback in wave 2 ended at 901.27. Expect the stock to extend higher 1 more leg to end wave 3, then it should pullback in wave 4 before turning higher again. Near term, as far as pivot at 853.6 low stays intact, expect pullback to find support in 3, 7, or 11 swing for further upside.

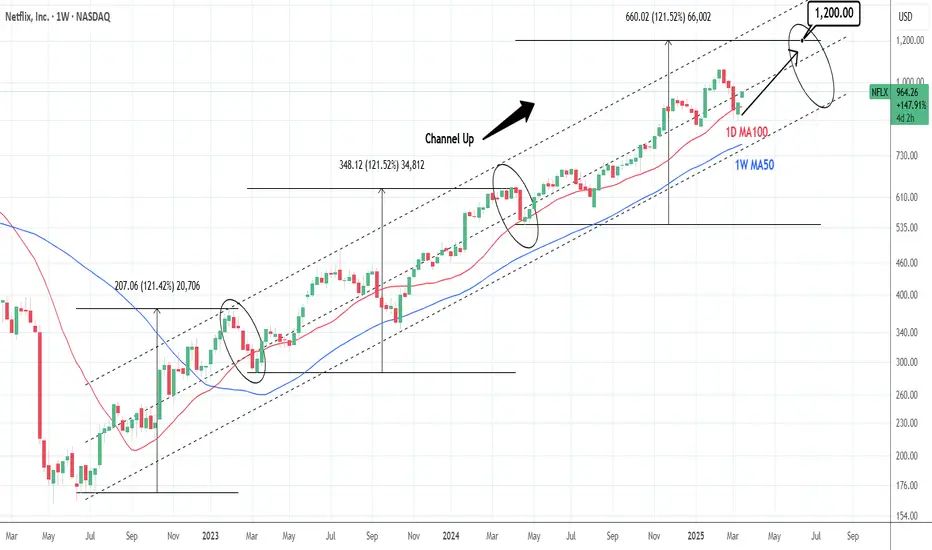
NETFLIX: Strong buy opportunity with this 1D MA100 bounce.Netflix is neutral on its 1D technical outlook (RSI = 52.399, MACD = -10.400, ADX = 30.636) and is rebounding on the 1D MA100. This is another HL on the 20 month Channel Up, which should be enough to give the stock a push to a new HH. The Channel Up is on its 3rd main bullish wave and both prior saw a +121.52% price increase. We expect the 3rd one to be completed by July. The trade is long, TP = 1,200.
## If you like our free content follow our profile to get more daily ideas. ##
## Comments and likes are greatly appreciated. ##
Netflix Caught in a Bearish Crab.The Netflix stock exhibited robust growth in 2024, primarily driven by a surge in subscribers and expansion into new markets.
However, a bearish Crab harmonic pattern has been identified on the chart, suggesting a potential significant price correction.
The pattern indicates that the stock price might initiate a decline from the 1029 level.
The XA, AB, BC, and CD legs of the pattern, defined by Fibonacci ratios, clearly outline the bearish formation. When coupled with other technical indicators, this pattern provides a compelling bearish signal for Netflix. Nevertheless, it's essential to remember that technical analysis alone is insufficient for investment decisions.
Fundamental factors, such as increasing competition, content costs, and changes in consumer preferences, should also be considered. Investors are advised to conduct thorough research and potentially consult with a financial advisor before making any investment decisions based solely on this technical analysis.
SEYED.

Max’s growth proves WBD’s content can compete with NetflixThis analysis is provided by Eden Bradfeld at BlackBull Research.
I’ve written a lot about WarnerBrothersDiscovery, and I’ve talked about it a lot in this newsletter.
Long story short — giant monolith formed by the merger of Discovery and the spun-out Warner assets of AT&T³.
The big issue was debt. They’ve managed to pay off a lot of debt — the company’s leverage ratio of 3.8x adjusted EBITDA is on its way to a ratio of 2.5x-3x gross leverage. They’ve paid a stunning 19 billion dollars of debt down in three years.
This led to their CEO, Zaz, being probably the most hated man in the industry. But that leads to strong cash flow — I’ve said before WBD is like a debt product with an equity stub; now it is slowly becoming a pure equity play, with cashflow up the wazoo — the point to remember here is that Max, the company’s streaming service, is growing well — Max added 4.5mn subscribers, versus analysts expecting 2.5mn. That’s proof in the power of their content — their IP — and it is an indication that the company’s content can compete with Netflix.
Stock is up 49% in 6 months, and trades around 11 bucks. If Zaz can continue to reduce debt, the stockholders should be very happy.

Pivoting Drop on Netflix. NFLXLast short idea was profitable for us, and I think this is a time for a pivot now. Price action is king. The drop down looked like ABC of a larger zigzag A wave, so now B which may be quite protracted. Fib goals here are for illustration purposes, as I recommend you never keep your goals stationary but use an adaptive indicator or indicator pair to exit.

Netflix: New All-time High!As expected, Netflix reached a new all-time high at $1,067, completing the magenta wave . Since then, the stock has already pulled back by nearly 20%. The ongoing magenta wave should extend further into our new magenta Target Zone, which spans $789.04 to $704.43. Since we anticipate a sustainable rebound from this range, it presents an opportunity to initiate or expand long positions. Such long entries could be hedged with a stop 1% below the Zone’s lower boundary, as there is a 30% chance that Netflix will drop below the Zone to complete the green wave alt. .
