Opening (IRA): PYPL February 21st 77.5/82.5/97/102 Iron Condor... for a 1.66 credit.
Comments: Earnings announcement volatility contraction play.
Metrics:
Max Profit: 1.66
Buying Power Effect: 3.34
ROC at Max: 49.70%
50% Max: .84
ROC at 50% Max: 24.85%
PYPL trade ideas

PYPL Building a Base or Faking a Bounce? All Eyes on This CHoCH!Market Structure & Price Action
PayPal (PYPL) is showing early signs of a potential reversal after forming a CHoCH (Change of Character) near the $66 level following a prior BOS (Break of Structure) and key demand reaction around $63.38. The price is now trading inside a retest range from a previous order block and pushing higher with a bullish structure of higher lows. A clean ascending trendline supports the move, with price respecting the diagonal base.
MACD is showing light momentum to the upside, and Stoch RSI is coiled just under overbought — signaling possible short-term consolidation before continuation or a breakout.
Key Levels to Watch:
* Resistance Zone (Supply): $71.50 – $72.00
* Support Zone (Demand): $63.38 – $64.57
* Breakout Trigger: Over $66.50 with volume
* Breakdown Trigger: Below $63.38 BOS zone
GEX & Options Flow Sentiment
* GEX Walls (Gamma Exposure):
* Highest Call Wall / Resistance: $72.00
* Put Wall / Support: $63.00
* Options Oscillator (Pro):
* IVR: 39.7
* IVx avg: 45.3
* Call$: 12.6%
* GEX: 🟢🟢🟢
* Bias: Slightly Bullish into resistance, volatility could expand above $67.
Trade Setup Ideas
Bullish: If price holds above $65.50 and breaks $66.50, we may see a squeeze toward $69 and eventually $71.
* Entry: $66.50
* Stop: $64.70
* Targets: $69 / $71.50
Bearish: Failure to break $66.50 with rejection + bearish divergence may offer a put opportunity toward $63.
* Entry: $65.70 rejection or breakdown below $64.50
* Stop: $66.60
* Target: $63.50 / $62.80
Conclusion
PYPL is bouncing within a consolidating range, and the CHoCH suggests possible accumulation. A breakout above $66.50 confirms strength; otherwise, it’s a fade back to support. Watch the trendline and volume closely this week.
Disclaimer
This analysis is for educational purposes only and does not constitute financial advice. Always do your own research and trade responsibly.

Consider Short Position as PayPal Faces Bearish Trends
- Key Insights: PayPal's stock is under bearish pressure. The share price has
broken past its 200-day moving average, typically signaling a downward
trend. Current options trading behavior reflects this caution, with
adjustments being made to manage losses. A key observation is the strategic
options trade involving a $66 strike call, suggesting a limited upside is
anticipated. The market shows weak upward momentum, while a failure to
maintain support levels has increased caution.
- Price Targets: Given the bearish sentiment, consider shorting PayPal.
- Short-term target (T1): $63.00
- Further target (T2): $60.00
- Stop Level 1 (S1): $71.00
- Stop Level 2 (S2): $74.00
- Recent Performance: PayPal's stock has been trading between $65 and $70,
breaking its 200-day moving average, indicating a bearish trend. Strategic
options trades with a $66 strike call highlight an attempt to capture a
marginal upside if the stock rises to $68. However, bearish signals below
$77 suggest further downside potential as previous support levels have been
breached.
- Expert Analysis: Market experts suggest a cautious stance on PayPal. The
management of call options and reevaluation of positions underscores the
lack of bullish momentum. Traders are selling calls to close positions and
opting for lower strike options to mitigate losses, reflecting an overall
conservative approach amid unclear market conditions.
- News Impact: PayPal's achievement of reaching a $30 billion benchmark in
lending underscores its influence in financial technology. While
significant, this milestone hasn't directly affected the current options
strategy but highlights its potential for future growth. In parallel,
noteworthy developments in technology by companies like Nvidia may hint at
future fintech integrations that PayPal could explore, though this remains
separate from its immediate stock performance challenges.

PayPal's Market Crossroads: Rebound or Further Downside?Is PayPal Ready for a Comeback? Key Levels to Watch Now
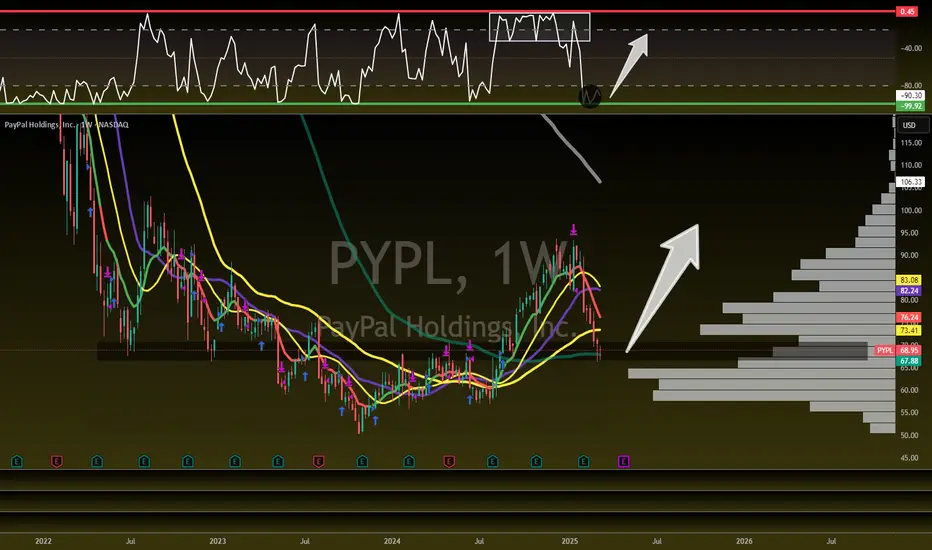
The digital payment giant PayPal (NASDAQ: PYPL) is at a crucial market intersection. Trading at $88.27, the stock has slipped 14.3% from its absolute high of $103.03, recorded over 900 days ago, but remains 75.6% above its multi-year low of $50.25. With recent buy-side volume spikes and a key resistance challenge at $89.34, the question arises: Is PYPL gearing up for a bullish breakout, or will sellers take control again?
The RSI14 at 33.35 signals an oversold condition, while the MFI60 at 38.5 suggests weakening selling pressure. Meanwhile, major moving averages remain clustered near $89.2-$89.49, hinting at a decisive moment ahead. Adding to the mix, the VSA Buy Pattern Extra 1st recently emerged, a sign of potential accumulation after a sharp decline.
Market sentiment is further fueled by macroeconomic uncertainties, interest rate expectations, and sector-wide volatility in tech and fintech stocks. Will buyers push past resistance, or is another wave of selling ahead? For investors and traders alike, this could be the defining moment to make a move.
PYPL Roadmap: Decoding the Market’s Next Move
The market never moves in a straight line—it's a battlefield of buyers and sellers, where every pattern leaves a footprint. Let's break down PayPal’s (NASDAQ: PYPL) recent price action using the roadmap of confirmed patterns that actually played out, filtering out the noise and focusing on what mattered.
January 27, 2025 - Buy Volumes Max (Buy Signal) PYPL opened at $89.57, climbed to $90.29, and closed at $90.24, with strong buy-side dominance. This signaled the start of an accumulation phase, pushing the price upward.
January 28, 2025 - Buy Volumes Max (Buy Confirmation) The momentum carried forward as PYPL opened at $87.87, surged to $89.36, and closed at $89.16. This confirmed the previous buy signal, proving that demand was actively stepping in. The low of the last three bars at $86.88 acted as the trigger, validating the long setup.
January 28, 2025 - Sell Volumes Max (Reversal Signal) Right after buyers showed strength, sellers hit back hard. The stock opened at $88.82, peaked at $88.85, but closed weak at $88.17. This shift hinted that smart money might be cashing out after the recent rally.
January 30, 2025 - Increased Sell Volumes (Bearish Confirmation) The downward momentum continued as PYPL opened at $90.11, dropped to $88.84, and closed at $89.56. The trigger was met—the breakdown from the previous low played out, confirming that sellers had control.
January 31, 2025 - VSA Buy Pattern Extra 1st (Bullish Reversal) The market didn’t stay bearish for long. A new buy pattern formed as PYPL hit a low of $88.28, bounced off, and closed at $88.56. This was a classic Volume Spread Analysis (VSA) buy signal—a sign that buyers were absorbing supply before a potential upward move.
What’s next? With resistance looming at $89.34, the market is at a crossroads. If bulls take charge, we could see a push to $91.44 and beyond. But if resistance holds, another leg down might be in the cards.
Technical & Price Action Analysis: Key Levels to Watch
When it comes to trading, levels are everything. Whether you’re scalping, swing trading, or positioning for the long haul, understanding where price reacts is what separates winners from bag holders. Here’s the must-watch roadmap for PayPal (NASDAQ: PYPL). If these levels fail, expect them to flip into resistance—because in this game, what was support can quickly become a selling zone.
Support Levels (Dip-Buy Zones)
85.905 – First line of defense. If bulls hold, expect a bounce play. If lost, it’s a new ceiling.
80.96 – Mid-range safety net. A break below would signal real weakness.
79.16 – The last soft support before things get messy.
71.19 – A break here sends alarms—this level needs to hold.
59.9 – If we hit this, something bigger is at play. A strong reaction is expected.
Resistance Levels (Profit-Taking & Rejection Zones)
89.34 – Immediate wall. Bulls need to flip this to keep momentum alive.
91.445 – Strong barrier. A clean break could open breakout conditions.
93.85 – High probability rejection zone. Needs volume to push through.
96.12 – Final boss before a larger rally.
Powerful Support Levels (Last Line of Defense)
102.57 – If we ever reclaim this, it’s game on for higher timeframes.
Powerful Resistance Levels (Big Money Zones)
81.46 – Needs to turn into support for a true trend shift.
70.46 – Heavy weight here. Any test is make-or-break.
58.5 – Historical battleground. Expect strong reactions.
51.09 – If bulls conquer this, deep discount buyers will wake up.
💡 Trading Playbook: If support doesn’t hold, don’t marry the trade—watch for the level to flip into resistance. Same applies in reverse—if resistance breaks, it could be the fuel for a strong bullish continuation. Stay sharp. 🚀
Trading Strategies Using Rays: Precision Entries & Probable Targets
The market moves in waves and phases, not in straight lines. That’s why using Fibonacci-based dynamic rays allows traders to catch moves from ray to ray instead of chasing price at random levels. Each ray is constructed from the beginning of a movement, not traditional highs and lows, making it a leading indicator for upcoming reversals or continuations.
The interaction with rays is what defines trade opportunities. A position is taken only after price touches a ray and confirms movement. Each next ray becomes the target for the trade. Alongside this, the Moving Averages (MA50, MA100, MA200, MA233) act as dynamic factors of support and resistance, strengthening key zones.
💡 Two Trade Scenarios: Be Ready for Both
Optimistic Scenario (Breakout & Trend Continuation)
If PYPL pushes above $89.34 resistance and secures a close, momentum traders can look for:
Entry: After interaction with the ray at $89.34
Target 1: $91.445 (next ray)
Target 2: $93.85 (if buying volume confirms)
Target 3: $96.12 (longer-term extension)
🚀 Trade Rationale: Bullish confirmation through ray breakout & support retest. RSI & MFI confirming strength.
Pessimistic Scenario (Rejection & Drop to Lower Rays)
If PYPL fails to break $89.34 and shows weakness:
Entry: After rejection from the ray at $89.34
Target 1: $85.905 (next lower ray)
Target 2: $80.96 (if bearish continuation forms)
Target 3: $79.16 (major liquidity grab zone)
🔥 Trade Rationale: If price rejects resistance and closes below MA50/MA100, sellers gain control.
💰 Potential Trade Setups Based on Ray Interactions
Ray-to-Ray Breakout Trade (Momentum Play)
If price closes above $89.34 → Enter long targeting $91.445.
If price closes above $91.445 → Ride the wave to $93.85.
Ray-to-Ray Breakdown Trade (Short Play)
If price fails at $89.34 → Enter short to $85.905.
If price loses $85.905 → Target next ray at $80.96.
Moving Average Interaction Play (Reversal Signal)
If price bounces off MA233 ($88.67) → Go long, targeting next ray up.
If price breaks below MA233 → Short it down to next key ray.
These strategies allow flexibility—reacting to price instead of guessing moves. Whether it’s a breakout ride or a rejection short, the market always provides opportunities for those watching the right signals. Stay ready. 🚀🔥
What’s Next? Let’s Talk in the Comments!
Trading isn’t just about setups—it’s about understanding the game and watching how price reacts to key levels. That’s why I want you to do one thing: save this idea, hit Boost, and check back later to see how price moves according to my ray-based system.
Have questions or want to discuss a specific asset? Drop a comment! I always read them and will answer whenever I can. Want a full breakdown on your favorite stock, crypto, or forex pair? Let’s talk—I can do some analysis publicly or, if you want to keep it private, we can work something out.
My indicator automatically maps out all rays and key levels—no guesswork, just clean structure. But it's available only in Private. If you’re interested, send me a message, and I’ll explain how you can get access.
And if you want a custom markup for any asset, I can do that too. Just hit Boost, drop your request in the comments, and I’ll add it to my list. If you're serious about improving your trading, follow me here on TradingView—this is where I post real setups that actually play out.
Markets move, opportunities come and go—let’s make sure you catch the next one. 🚀🔥

$PYPL - Uh oh!NASDAQ:PYPL How wrong was I? Things were looking up until tariff and stagflation news delivered a one-two punch to the market.
Friday’s candle broke below the support level with good volume.
It is getting very close to retesting the uptrend line that started back in October 2023. They’d better start deploying those buyback dollars before that trendline breaks.
The worst-case scenario for the bulls is the $59 to $57 area, which is a good area to load.

PYPL PUTS ON: PAIN PAL FORECAST FY25if it dont pay it pains from bad trades to gold diggin women we are counting down
the biggest L's of 2025
last year i was wrong but i did catch 24% of it plus weekly timeframe gives me plenty of time to correct my errors now im absotut-e-ly positive we negative hard this semester season year
i had to make it technical so the technicalist's here can relate
break of the first green trendline was the first indication after rejecting my zone
now we looking for the retest which wont break the smaller timeframe downtrend trendline
once the retest is confirmed me and the big money taking our shorts if you scared hey cool thats fine this aint advice anyway keep buying paypal lets see who laughs last
you bag holders (holding garbage bags cause mc donalds aint hiring this coming recession lol)
imma spice this up imma only get out by margin call if im wrong yea yeaaaaa
im going for 2025 degen of the year
i see over -200% if i stack this humbly

PayPal - Multiple Signals Pointing to a Potential Bottom!I’ve just entered a position in PayPal, and the reason is that several overlapping factors are lining up in a way that suggests a potential bottom may be in.
First, it looks very likely that Wave (2) is complete. The stock tapped the 61.8% Fibonacci retracement level with precision and has held that level over the past few days – all while the RSI has been climbing, which is a strong bullish divergence signal in my book.
Second, PayPal just touched last year’s VWAP level perfectly, which I view as another strong technical indicator for a potential reversal.
How far this move could go is still unclear, but the open gap above is definitely something I’m watching closely. For that to be in play, $71 needs to be reclaimed. And from here on, $66 should not be touched again.
That’s my plan – and that’s how I’m trading it. Let’s see if the market plays along.

A+ dip entry setup here!boost and follow for more ❤️🔥 very simple setup here on Paypal, holding above previous resistance which is now the new support since its last breakout.. Also holding above trend support zone from October 2023.
It could dip a bit more to 63-70 but I think a rally higher 90s and 100s should happen either way. 🎯


PYPL Long OpportunitySimple EWT in play -- finally retested the top of the previous lower range, finishing the formation of the broader inverse H&S pattern.
Will update with more fundamentals as I continue research, but feel the e-commerce competition is overblown and the company is generally undervalued.


ContinuationAny way you look at this, the chart looks insanely bullish.
The moves it has made in the arch looks a mirror to what it done throughout the years prior and gives me the impression we should see some aggressive moves upwards in the coming weeks. We can dip outside the arch as it has done that before, but it doesn't change its path. Lets hope it finds the momentum and reaches the Fibonacci target which is sitting in the 120-130 zone.
P.S:
Funnily enough, this is the exact same pattern as SQ (XYZ) so I will be doing a copy and paste as the direction potential is the same.

PYPL IS BEING PREPAREDI think the price will rise from the 65-67.5 price range. It is a nice range and we can see it as a test of the area it breaks. Although 75 is the first resistance, it should not bring much selling. After staying above 78, I expect a movement towards the 86 gap and the 110 region.


PayPal: We've been here before (?)August 2019, PYPL saw the same market structure as we see now (1:1). Market has currently dropped on weak payment transactions but the forecast and main figures remain strong.
Currently PYPL is trading with multiples below fintech's average with P/E 17 (sector 84), market price 100 USD (1:1 target) would make P/E about 22,5, which still makes sense in context of current tech valuations, that are often priced at significantly higher multiples.


$PYPL PAYPAL’S FINANCIAL LANDSCAPE: VALUATION & OPPORTUNITIESPAYPAL’S FINANCIAL LANDSCAPE: VALUATION & OPPORTUNITIES
1/8
PayPal ( NASDAQ:PYPL ) has been on the move lately—announcing a FWB:15B buyback and posting mixed but intriguing earnings results. Let’s dive into what’s making this fintech giant tick! 💳💡
2/8 – Recent Revenue Growth
PayPal’s revenue soared during the digital payment boom but has moderated recently.
Although the exact figures aren’t in the latest posts, growth since 2017 is substantial.
Stabilization might indicate a new normal in digital payments.
3/8 – Earnings & Guidance
Some quarters saw EPS pop by 61%—pretty impressive! 🚀
Mixed guidance ahead: margin expansion concerns and flat-to-down cash flow.
The FWB:15B buyback suggests management sees long-term potential.
4/8 – Valuation vs. Peers
Forward P/E near 10, PEG ratio of 0.52—that’s cheap compared to Visa/Mastercard.
PayPal straddles fintech + payments, competing with everyone from Square ( SET:SQ ) to Apple Pay.
Lower growth vs. some peers, but strong operating margins help PayPal stay ahead.
5/8 – Risk Factors
1️⃣ Regulatory: New rules could cramp expansion.
2️⃣ Market Saturation: Need emerging markets to fuel next leg of growth.
3️⃣ Competition: Stripe, Apple Pay, & countless fintech upstarts.
4️⃣ Tech Disruption: Blockchain, AI, or next-gen payments could reshape the landscape.
6/8 What’s PayPal’s biggest near-term challenge?
1️⃣ Regulatory Hurdles
2️⃣ Competition
3️⃣ Market Saturation
4️⃣ Tech Disruption
Vote below! 🗳️👇
7/8 – SWOT/SCOT
Strengths: Massive user base, recognizable brand, buyback confidence.
Weaknesses: Slowing user growth, uncertain future margins.
Opportunities: Emerging markets, strategic partnerships, AI integration.
Threats: Fierce competition, cyber risks, evolving payment tech.
8/8 – Your Next Move?
PayPal’s at a pivot—undervalued or a value trap? 💰
Let’s see if NASDAQ:PYPL can keep up the momentum!
#PayPal #Fintech #DigitalPayments #PYPL #Investing #Earnings #Valuation #Finance

PYPL: Buy ideaOn PYPL as you can see on the chart, we would have a high probability of seeing the market go higher. This is explained by the fact that we have a red candle with a small body and a long wick which signals us to a possible rise in the market. In addition, this increase will be confirmed by the appearance of a large green candle accompanied by a large green volume which will cause the Vwap indicator to forcefully break, hence this upward trend.

PYPL : Another Dive or Finally Time to Buy?PayPal (PYPL) has been getting slapped around like a rookie in a heavyweight fight. The stock is now chilling above a thick support zone—right above the 50% and 61.8% Fibonacci retracement levels. Sounds like fancy chart talk, but all it really means is: This could be where the pain finally stops.
There's also an unfilled gap across multiple timeframes, and gaps like these tend to get filled at some point. If NASDAQ:PYPL keeps sliding, it might take out the previous quarterly low. Why does that matter? Because these lows act like a magnet, dragging price down just enough to shake out weak hands before launching higher. That’s when the selling pressure finally dies down. And the RSI? Almost in the basement—last time we saw this (November 2023), PYPL ripped higher shortly after.
My plan? Set alerts, watch closely, and pounce when the signs point to a reversal. I’m not about to catch a falling knife, but if this thing turns around, I sure as hell don’t want to be left behind.

Can AI Predict the Future of Payments?PayPal stands at the vanguard of the digital payment revolution, not merely as a facilitator but as an innovator through its strategic use of artificial intelligence (AI). This article delves into how PayPal is harnessing AI to redefine the parameters of financial transactions, challenging the reader to envision the future landscape of digital payments.
PayPal's integration of AI into its operational core has transformed it from a standard payment gateway to a leader in financial technology. By enhancing payment authorization rates and strengthening fraud prevention, PayPal leverages AI to predict and adapt to user behaviors and transaction patterns. This predictive capability ensures smoother, faster, and more secure transactions, pushing the boundaries of what was previously thought possible in digital payments.
The application of AI to improve payment authorization is particularly groundbreaking. Through sophisticated analysis of vast datasets, PayPal's AI models can predict declines, suggest retry strategies, and optimize transaction processing. This not only led to higher authorization rates but also improved user experience, prompting businesses and consumers to reconsider the effectiveness of digital transactions.
In the realm of fraud prevention, PayPal's AI-driven approach sets a new standard. By employing machine learning and graph technology, PayPal maps out transaction networks to spot anomalies in real-time, drastically reducing fraud while minimizing disruptions from false positives. This dual focus on security and user experience presents a compelling case for how technology can be both a guardian and a facilitator in the financial world, urging us to consider the balance between innovation and safety in our digital interactions.
PayPal's journey with AI doesn't just highlight its current capabilities but also signals its readiness for future challenges in the digital payment landscape. As we ponder the implications of such technological advancements, we are invited to explore how AI could further shape the economy, security, and daily financial interactions, making PayPal not just a leader today, but a visionary for tomorrow.

