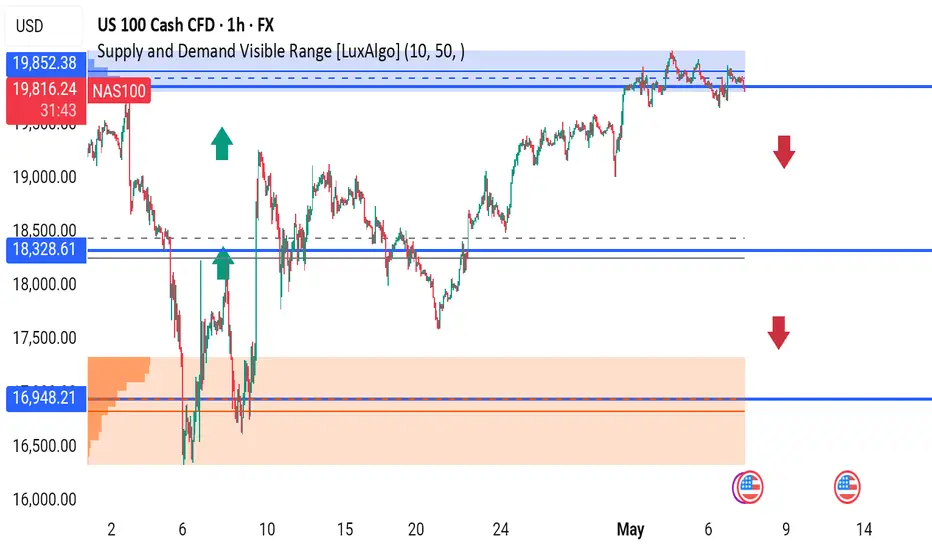
NAS100 1H | Major Rejection Zone – Time to Sell?NAS100 is trading inside a key supply zone, showing clear rejection signs near 19,825, with a potential downside move on the table.
Watch These Levels:
Resistance (Rejection Zone): 19,825
First Support: 18,328
Major Demand Zone: 16,948
Bearish Bias if price fails to break and close above 19,825.
A break below 18,328 could trigger a deeper drop toward 16,948.
Trade Plan:
Sell near 19,825 with SL above zone
Target 18,328 → 16,948
Bullish reversal only above clean breakout
What do you think—pullback or breakout?
#NAS100 #NASDAQ #Indices #PriceAction #SupplyAndDemand #SmartMoney #ForexTrading #TechnicalAnalysis #LuxAlgo #US100 #CFD
US100 trade ideas
The 243 Goldbach - Algo 2 BuySell Signal in ActionVery Nice Signals found one quick on the 15 min went to Mcdnlds came back .. 🥸🕵🏻♂️
💯 !

NAS100USD: Volatility Opens Door for Sell Setup in NY SessionGreetings Traders,
As we enter the New York session—a period known for heightened volatility—we note that NAS100USD remains in a broader bullish environment. However, current price action suggests the potential for a short-term reversal, prompting us to explore selling opportunities.
Key Observations:
1. Bearish Internal Structure Developing:
Despite the overall bullish trend, internal price action reveals a sequence of lower lows, indicating the formation of a bearish microstructure. This internal weakness is reflected in the way bearish arrays—such as mitigation blocks and fair value gaps (FVGs)—continue to act as resistance zones.
2. Mitigation Block & FVG Alignment:
Recently, price delivered a strong displacement to the downside, followed by a retracement into a mitigation block that aligns with a fair value gap. This confluence reinforces the bearish bias and suggests institutional selling may be active in this zone.
3. Downside Targets – Gap Fill & Liquidity Pools:
The first downside target is a nearby inefficiency (gap) in price action, which the market often seeks to fill. The second target lies below, where sell-side liquidity pools are likely resting.
Trading Plan:
Monitor price behavior within the current resistance zone. If confirmation of continued bearish momentum appears, short positions targeting the aforementioned levels may be viable.
Stay focused and wait for confirmation before committing to any positions.
Kind Regards,
The Architect


US100 WILL GO DOWN|SHORT|
✅US100 price grew again to retest the resistance of 20,300
But it is a strong key level
And we are already seeing
A local bearish pullback
So I think that there is a high chance
That we will see a bearish move down
SHORT🔥
✅Like and subscribe to never miss a new idea!✅
Disclosure: I am part of Trade Nation's Influencer program and receive a monthly fee for using their TradingView charts in my analysis.

Are You Ready For Nasdaq Next Flight ? 500 Pips Waiting For Us !Here is my opinion on Nasdaq , i think we have a very good closure and we can say we will go up for sometime in the next few days , so i`m waiting the price to go back to my support area ( Lower One ) that already broken , and then we can enter a buy trade and targeting 500 pips . also if the price touch the higher place and give me a good bullish price action , we can enter a buy trade with small lot size and if the price go to the lower one we can add one more contract .


Descending Triangle Formation with Bullish Breakout Potential The NASDAQ (US100) is currently forming a descending triangle pattern with a clear A-B-C-D-E wave structure, signaling price compression and consolidation.
🔍 Key Insights:
The previous move was strongly bullish, increasing the probability of a continuation after consolidation.
A potential breakout above the descending trendline (blue resistance) could trigger a sharp upward move.
Target zones:
✅ First target: 20,060.6
✅ Second target: 20,573.9
Key support zone: 19,524.7 – this area acted as a launchpad for the previous bullish impulse and confirms the base of the triangle.
🧠 Suggested Strategy:
Wait for a confirmed breakout with volume. Look for entries on a pullback toward the 19,811.1 zone – ideally with a bullish continuation candle.
📊 Additional Context:
These types of consolidation patterns often lead to explosive moves. Patience and risk management will be crucial here.


NASDAQ (NDX) Market OutlookCurrently, the NASDAQ is trading around 19,723. We're anticipating a short-term pullback toward the 19,462 level, where a significant pool of liquidity awaits. This zone could act as a magnet for price in the near term. Once price reaches this area, we’ll closely monitor the lower timeframes for a potential bullish reaction or accumulation, which could signal the next leg higher.
Stay patient and let price confirm at key levels.


Technical Breakdown on US100 | 1H TimeframeTechnical Breakdown on US100 (1H) using Volume Profile, Gann, and CVD + ADX
1. Key Observations (Volume, Gann & CVD + ADX Focused)
a) Volume Profile Insights:
Value Area High (VAH): 20,050
Value Area Low (VAL): 19,800
Point of Control (POC): 19,927.77
Volume Nodes:
High-volume node: Consolidation around 19,930–20,000 (strong interest/acceptance zone).
Low-volume gap: Below 19,800 (potential area for fast price movement).
b) Liquidity Zones:
Clustered Stops:
Above recent highs at ~20,100 (liquidity trap).
Below recent lows near 19,650 and 19,500.
Order Absorption Zones:
Near 19,930–19,980: multiple rejections + high delta volume = passive sell pressure.
c) Volume-Based Swing Highs/Lows:
Volume spike highs: 20,050 (indicating rejection and potential reversal).
Volume spike lows: 19,600–19,650 (reaction points with increased volume and defense).
d) CVD + ADX Indicator Analysis:
Trend Direction: Turning bearish.
ADX Strength:
ADX slightly above 20 with DI- crossing above DI+ = Confirmed downtrend.
CVD Confirmation:
Falling CVD alongside price weakness = Strong supply taking control.
Multiple failed bullish attempts above POC.
2. Support & Resistance Levels
a) Volume-Based Levels:
Support:
19,800 (VAL)
19,650 (swing low with high absorption)
Resistance:
20,050 (VAH and rejection zone)
19,927.77 (POC, now resistance)
b) Gann-Based Levels:
Swing High: 20,100 (Gann reversal point)
Swing Low: 19,650
Key Gann Retracements:
1/3 retracement = ~19,820
2/3 retracement = ~19,980
3. Chart Patterns & Market Structure
a) Trend: Bearish
b) Notable Patterns:
Bearish flag forming inside descending channel.
Break below POC and VAL suggests breakdown continuation.
Retest failure near POC confirms resistance validation.
4. Trade Setup & Risk Management
a) Bearish Entry (CVD + ADX confirm downtrend):
Entry Zone: 19,920–19,940 (retest of POC)
Target:
T1: 19,650
T2: 19,400
Stop-Loss (SL): 20,060 (above VAH and swing high)
Risk-Reward (RR): Minimum 1:2
b) Position Sizing:
Risk only 1–2% of trading capital per setup.


NSDQ100 INTRADAY uptrend continuationUS-China Trade Talks:
The Trump administration is considering cutting tariffs on Chinese goods to below 60% during upcoming talks. China may reciprocate. Chinese exports to the US have already dropped sharply following earlier steep tariffs.
Global Market Reaction:
Germany's DAX index hit a new high, recovering losses from the trade war. European stocks are rising on hopes of lower tariffs and potential rate cuts from the European Central Bank.
US Tax Policy:
Trump is urging Congress to raise taxes on the wealthy, proposing a 39.6% rate for individuals earning $2.5 million or more (or $5 million for couples).
Panasonic Job Cuts:
Panasonic plans to cut 10,000 jobs to improve profitability by focusing on growth areas and reducing operations in weaker sectors like TVs and industrial devices.
Key Support and Resistance Levels
Resistance Level 1: 20530
Resistance Level 2: 20730
Resistance Level 3: 20950
Support Level 1: 19640
Support Level 2: 19325
Support Level 3: 19030
This communication is for informational purposes only and should not be viewed as any form of recommendation as to a particular course of action or as investment advice. It is not intended as an offer or solicitation for the purchase or sale of any financial instrument or as an official confirmation of any transaction. Opinions, estimates and assumptions expressed herein are made as of the date of this communication and are subject to change without notice. This communication has been prepared based upon information, including market prices, data and other information, believed to be reliable; however, Trade Nation does not warrant its completeness or accuracy. All market prices and market data contained in or attached to this communication are indicative and subject to change without notice.

NASDAQ YEARLY CHART Chart done on 03.05.2025
Nasdaq market conditions are very similar to the 2020 market conditions
as we can see for both years we had a drop in market price for the first few month, then the recovery happened as markets started to stabilize.
this looks to be the same with 2025 as trumps appointment into the white house has caused a similar effect
for the next year nasdaq looks to be bullish so that the US economy can adapt to the new changes.
this is a very basic analysis. if a more in depth analysis is needed. Please feel free to comment

NAS100USD: Price Respects Bearish Structure at 62% FibGreetings Traders,
In today’s analysis on NAS100USD, we observe sustained bearish institutional order flow, and we aim to align with this directional bias by identifying high-probability selling opportunities.
KEY OBSERVATIONS:
1. Retracement into Premium Resistance:
Price has recently retraced into premium pricing levels, reaching the 62% Fibonacci retracement zone—a level that often acts as dynamic resistance. This retracement also aligned with a bearish breaker block, confirming institutional resistance at that level. The market has since shown signs of rejection, reinforcing the bearish narrative.
2. Emergence of Fair Value Gap (FVG) as a Key Resistance Array:
Following the rejection, a new FVG has formed, acting as a potential short-term resistance zone. This area provides a refined point of interest where institutions may look to re-engage in selling activity. The alignment of the FVG with previous resistance adds further confluence to the bearish setup.
TRADING PLAN:
We will monitor the newly formed FVG zone for signs of bearish confirmation. Upon confirmation, the plan is to execute short positions targeting liquidity pools in discounted price zones, in line with institutional price delivery patterns.
Remain focused, wait for confirmation, and make sure this idea aligns with your overall trading plan.
Kind Regards,
The Architect

NASDAQ Buy idea🔸 Structure Breakout → Pullback → Consolidation beneath resistance
🔸 Support Zone Multiple rejections from 19,370–19,385 demand zone
🔸 Liquidity Stops likely resting above 19,420 → potential fuel for breakout move
🔸 Candle Behavior Strong rejection candles from demand zone + no bearish follow-through
🔸 Momentum Price failing to make lower lows → bullish pressure building


Following the Wave StructureAnalysis:
The NASDAQ100 appears to be following a classic 5-wave structure.
Currently, we are finishing Wave 3, with an expected corrective move toward the 50% Fibonacci retracement zone near 19,018.7.
From there, the chart suggests a continuation toward the 19,879 area (close to the daily 200 EMA) and, finally, toward the 20,866 target, completing the cycle.
Key zones:
Support: 19,018.7 (50% Fibo and strong structural level)
Resistance: 19,879.1 and 20,866.2
Additional levels: Daily 200 EMA and previous structural gaps
The path won't be in a straight line — expect consolidation and pullbacks along the way. However, the bullish projection remains intact as long as the 19,018.7 support holds.
Let's keep riding the wave! 🌊


US100 BREAKS DOUBLE BUTTOM NECKLINE! US100 successfully breaks a neckline of a double buttom like structure! We may continue to see a continuous movement in price to the upside. Next resistance level could be the area of 20,267 (pullback resistance)
A buy opportunity is envisaged from the current market price

