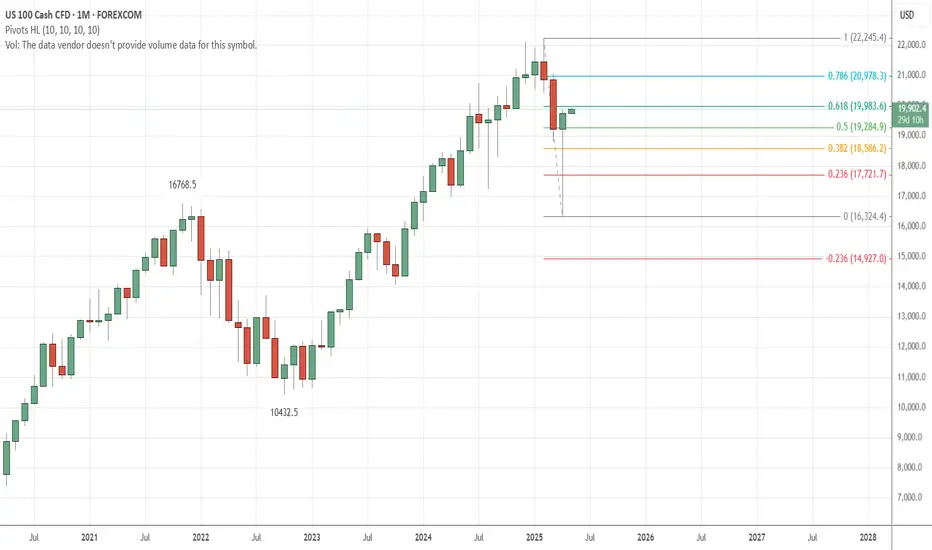
NAS Targets 21,720- 21,800 Makers holding this thing up...Long for next 2 weeks then, mid May after options expirations... very cautious. 21,720- 21,800 is pivot where one might want to consider taking profits or trying shorts, sfterwards market could go anywhere
US100 trade ideas

NAS100USD: Bullish Scalping Opportunity from SupportGreetings Traders,
In today’s analysis of NAS100USD, we identify bullish institutional order flow, and as such, we aim to align with this narrative by seeking buying opportunities.
This setup presents a scalping opportunity on the lower timeframes, with price currently reacting to a bullish order block serving as a key institutional support zone. Upon confirmation, we anticipate a move toward the liquidity pool in premium pricing, which will serve as our target zone for profit-taking.
As always, remain disciplined, wait for clear confirmation, and manage risk accordingly.
Kind Regards,
The Architect

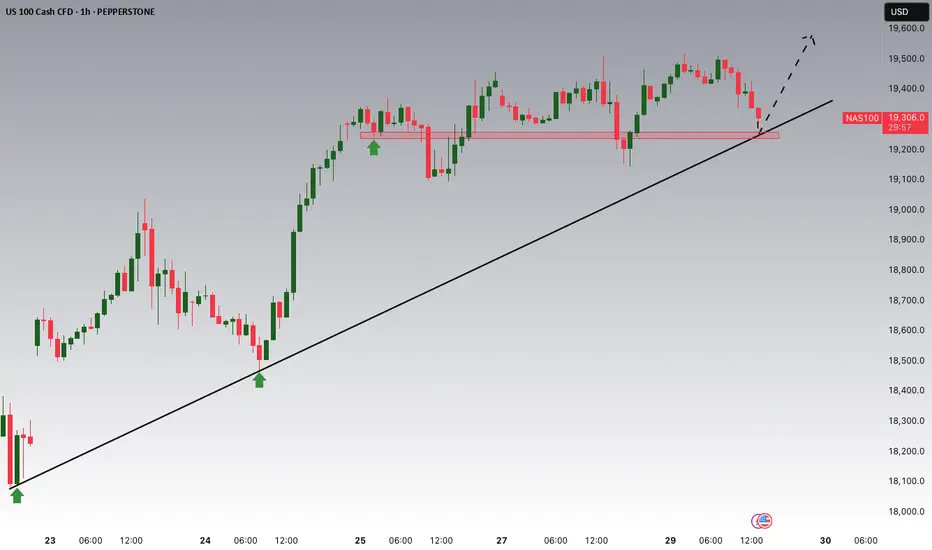
Trendline break out NAS100## Entry
- Enter on 4H confirmed trendline breakout
- Look for retest of broken trendline as support
- Ensure price remains above key MAs on 4H
- Verify with increased volume on breakout
## Risk
- Stop below recent swing low/structure
- Risk 1-2% capital
- Size position accordingly
## Targets
1. 20000- 20200 as psychological level
2. 200 MA on daily timeframe
3. 1.5x risk-reward ratio
## Management
- Wait for clean 4H breakout confirmation
- Move stop to breakeven after momentum continues
- Trail stop as price advances toward targets
- Scale out at major resistance levels

NAS100 | 4H Bullish Breakout from Channel – Eyes on 19,970 ZoneNAS100 4H Chart Analysis
Price broke out of a well-respected descending channel with a strong bullish push. Currently approaching a supply zone around 19,970, where we may see a reaction.
Key Levels:
• Resistance/Supply: 19,970
• Support: 19,450 / 18,823
Technical Notes:
• Breakout confirmation above descending trendline
• Clean retest zone formed at previous structure (around 18,800)
• Watching for either a rejection at supply or continuation into 21,000+
Next Steps:
• Waiting for confirmation: reaction or break of the 19,970 zone
• Will look for 15m–1H entry if we get a pullback to structure

NASdaq_ Bullish trendline check and breakoutToday the Nasdaq made a Bullish trendline check and breakout to the up-side. Looks to be a sustainable rally. Also the Ichimoku is breaking out on the daily.
If you have hedge positions this the potential BULL rally you might need to manage those position through.
Seems we are lining up for good news, Bullish narrative: Ukraine mineral deal, May 06-07 interest rate cut, trade deals with India, Japan, Italy Australia, Mexico, Russian Ukraine peace deal. after that who knows

Technical Breakdown on US 100 | 1H TimeframeTechnical Breakdown on US100 Cash CFD – 1H Chart Analysis using Volume Profile, Gann, and CVD + ADX
1. Key Observations (Volume, Gann & CVD + ADX Focused)
a) Volume Profile Insights:
Value Area High (VAH): 21,250
Value Area Low (VAL): 20,850
Point of Control (POC): 20,847.54 (Previous), 20,084.76 (Earlier POC)
High-volume nodes:
Strong cluster near 20,850–21,000: confirmed price acceptance.
Minor node around 21,235–21,250: current area being tested.
Low-volume gaps:
Between 21,050 and 21,150 – fast move area if price breaks.
b) Liquidity Zones:
Upside:
21,250 (new high, recent wick rejection) – likely stop clusters above.
Downside:
21,000 – last breakout consolidation zone.
20,850 – absorption and prior POC zone.
Absorption Zones:
Significant delta volume activity near 20,850 – signs of large orders being filled.
c) Volume-Based Swing Highs/Lows:
Volume spike reversal high: 21,250 (upper wick + rejection)
Volume spike reversal low: 20,850 (strong bounce)
d) CVD + ADX Indicator Analysis:
Trend Direction: Confirmed uptrend, now showing signs of range-bound behavior post-breakout.
ADX Strength:
ADX > 20, DI+ > DI- earlier = strong uptrend.
Currently flattening, indicating possible transition to range/consolidation.
CVD Confirmation:
Rising CVD during breakout leg, now diverging (sideways/slight dip) = demand exhaustion possible.
2. Support & Resistance Levels
a) Volume-Based Levels:
Support:
VAL: 20,850
POC: 20,847.54
Psychological & structural: 21,000
Resistance:
VAH: 21,250
Previous intraday top: 21,243–21,250
b) Gann-Based Levels:
Swing High: 21,250
Swing Low: 20,084
Key retracement levels (from 20,084 to 21,250):
1/2: 20,667
1/3: 20,472
2/3: 20,889
3. Chart Patterns & Market Structure
a) Trend:
Bullish overall, transitioning into range-bound consolidation at the top.
b) Notable Patterns:
Channel/Wedge forming above 21,000 with downside risk to mid-level support.
Potential double top near 21,250 with divergence in CVD.
Volume gap retest likely if price slips below 21,100.
4. Trade Setup & Risk Management
a) Bullish Entry (If CVD + ADX confirm uptrend continuation):
Entry Zone: 21,000–21,030 (retest support + consolidation base)
Targets:
T1: 21,200
T2: 21,250
Stop-Loss (SL): 20,850
RR: Minimum 1:2
b) Bearish Entry (If CVD + ADX confirm trend reversal):
Entry Zone: 21,240–21,250 (supply zone + divergence)
Target:
T1: 21,000
Stop-Loss (SL): 21,300
RR: Minimum 1:2
c) Position Sizing:
Risk 1–2% of trading capital per trade for optimal capital preservation.

US100 BREAKS DOUBLE BUTTOM NECKLINE! US100 successfully breaks a neckline of a double buttom like structure! We may continue to see a continuous movement in price to the upside. Next resistance level could be the area of 20,267 (pullback resistance)
A buy opportunity is envisaged from the current market price

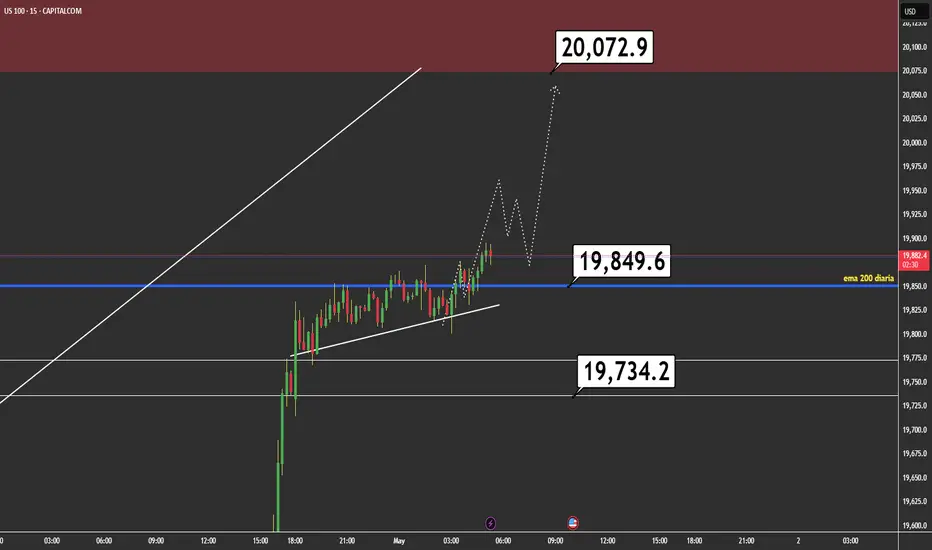
Navigating the Next Trend MoveOverall Trend:
The price shows a clear uptrend, as indicated by the ascending channel (sloping yellow lines). The price has been respecting this channel, with higher lows and higher highs.
Support and Resistance:
Support: The 19,734.2 level (marked on the chart) has acted as a key support. The price bounced from this level after a correction.
Resistance: The 19,849.6 level (also marked) appears to be a resistance zone, as the price has shown difficulty breaking above it on a sustained basis.
Projection: The price is approaching potential resistance at 20,072.9, which could be a target if the uptrend continues.
Indicators:
200-period EMA (blue line): The price is above the 200-period EMA, confirming the uptrend on this timeframe. The EMA is around 19,889.4, acting as dynamic support.
Patterns and Structure:
The price has broken out after consolidating near the 200 EMA and the support at 19,734.2, suggesting that buyers are in control.
Possible Scenarios:
Bullish Scenario: If the price breaks the resistance at 19,849.6 with increasing volume, it could head toward the target at 20,072.9. This would confirm the continuation of the uptrend within the channel.
Bearish Scenario: If the price fails to break above the resistance at 19,849.6 and confirms the pin bar with a downward movement, it could correct toward the support at 19,734.2 or even the 200 EMA at 19,889.4.
Trader Recommendation:
Long Entry (Buy): Wait for a breakout and close above 19,849.6 with confirmation (e.g., a strong bullish candle or increased volume). The target would be 20,072.9, with a stop loss below 19,734.2.
Short Entry (Sell): If a rejection at 19,849.6 is confirmed (e.g., with a bearish candle following the Pin Bar), consider a sell entry with a target at 19,734.2 or the 200 EMA, placing a stop loss above 19,849.6.
Conclusion:
The US 100 is in an uptrend, but the resistance at 19,849.6 and the Pin Bar suggest caution. Traders should wait for confirmation before entering positions, either to take advantage of the bullish continuation or a possible correction. Managing risk is key, especially on a 15-minute time frame, where volatility can be high.
Possible reversal of this bullish wave...(LOG)Orange circles highlight repeated price rejection and the formed doji that suggests a slowdown in a bullish wave and potential reversal. The confluence of the descending trendline and horizontal supply/resistance zone creates a high-probability reversal or breakout from this triangle.
If the price rejects again from the current supply zone and triangle, short setup toward the Fibonacci retracements or demand zones (18300 and below).
If the price breaks above the descending trendline, bullish continuation will likely target 20,000+ (Swing H).
Trend remains down.
Entry 19300
TP 18300 below
Target 14k.

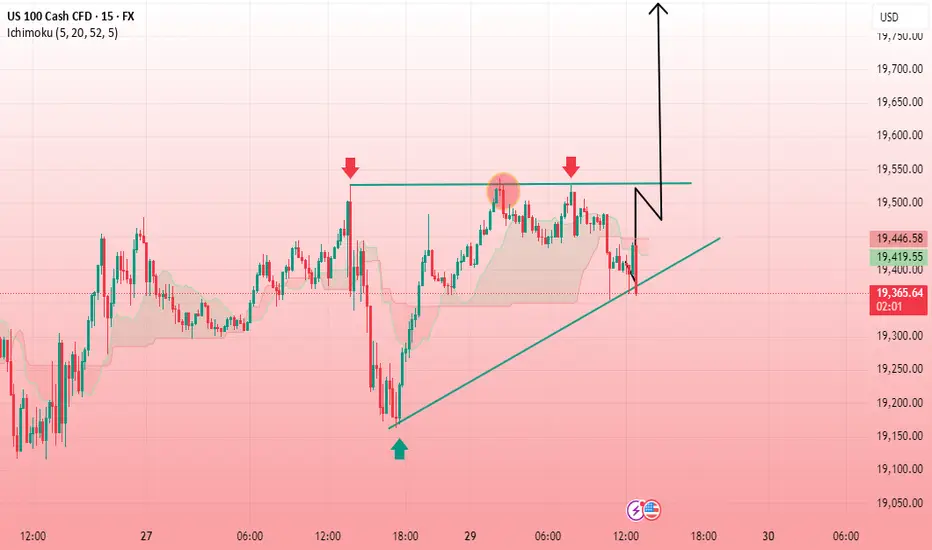
USNAS100 30M CHART PATTERN echnical Analysis Summary
Chart Pattern Observed:
The chart shows a clear ascending triangle pattern, which is a bullish continuation pattern. This is formed by a horizontal resistance level (around 19,550) and a rising trendline (higher lows), suggesting buying pressure is building up.
Key Levels:
Resistance Zone: 19,550
Support Trendline: Rising from ~19,050 to current level
Current Price: ~19,580
Breakout Target: 19,800.00 (as marked)
Interpretation:
Price has tested the 19,550 resistance multiple times without breaking lower significantly, indicating strength.
A breakout above this resistance would confirm the bullish triangle pattern.
The projected target, calculated using the height of the triangle added to the breakout level, is around 19,800.
Volume confirmation would further strengthen the breakout's validity (not shown here).
Potential Strategy:
Buy on breakout above 19,550, ideally with volume confirmation.
Take Profit: Around 19,800, per the measured move projection
NASDAQ: Rejected on the 1D MA50. Can it break it?Nasdaq is neutral on its 1D technical outlook (RSI = 52.608, MACD = -100.810, ADX = 23.609) as it got rejected today on the 1D MA50. That is the first serious Resistance test of the April 7th rebound and until it breaks, we can see a technical pullback to the 4H MA100 in order to establish the new Support. With the 1D RSI confirmed the new long term bottom with a DB, buying the dips on every such pullback is the most effective strategy on such occasions. Our short term target is the R1 level (TP = 20,300).
## If you like our free content follow our profile to get more daily ideas. ##
## Comments and likes are greatly appreciated. ##

Nasdaq: Where should I buy from next? New bullish orderblockWe are hunting the next buyzone already. The correction zone is printing now.
This is how you accurately forecast your next entry ahead of time. Learn how corrections should work. Long below higher time frame (Hourly/Daily/Weekly) lows is the name of the game.
This should be easy work, and you can feel free to look for longs below 15m lows on the way to the targets above. Once we hit those, we should look for correction after closing below hourly candles, the same way we were able to freely take long after close above hourly candles today just as I prescribed while it was dropping.
This is just the rules of the game 🔓 gotta be sharp enough to observe them and trust the mechanics. Thanks for tuning in


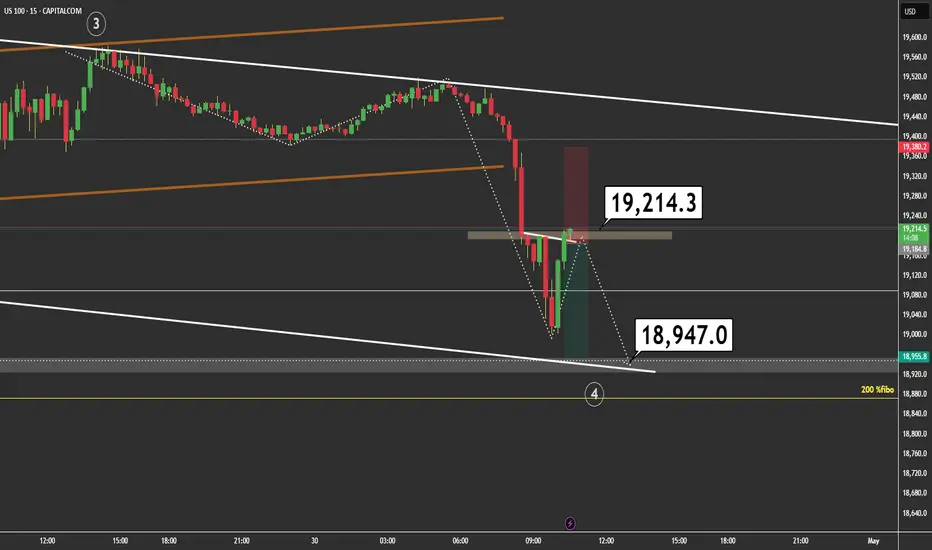
Hits Supply ZoneAfter a sharp drop, price is retracing and reacting to the 19,214.3 resistance zone.
Still inside a descending channel, targeting 18,947.0, where dynamic support and the 200% Fibonacci extension align.
🎯 Entry: Clear rejection from resistance
🛑 Stop: 19,380
✅ Target: 18,947
⚠️ Active management recommended – possible reaction at mid-channel
Structure still confirms bearish momentum (wave 4 in progress). Watch out for fake breakouts!
Breakout or Rejection at Key ResistanceSupport and Resistance Levels:
Resistance: 19,856.6 is a key level where the price has recently been rejected.
Support: 19,146.4 is a major support, with an intermediate level at 19,516.0 acting as a pivot point.
Trend and Structure:
The price has broken a descending trendline (white dotted line), suggesting a potential trend reversal from bearish to bullish.
Currently, the price is consolidating between 19,516.0 and 19,856.6, indicating indecision.
Indicators:
EMA 200 (Daily): The price is below the EMA 200 (19,856.0), indicating that the long-term trend remains bearish until the price sustains above this level.
Fibonacci: The 138% / 50% Fibonacci retracement level (18,950.0) has acted as support in the recent past.
Bullish Scenario:
If the price breaks and holds above 19,516.0 with volume, it could target the resistance at 19,856.6.
A confirmed break above 19,856.6 (with a close above the EMA 200) could signal bullish momentum toward 20,000 or higher.
Bearish Scenario:
If the price fails to hold above 19,516.0 and breaks lower, the next key support is at 19,146.4.
A drop below 19,146.4 could push the price toward 18,950.0 (Fibonacci level).
Recommendation:
Long Entry: Wait for a confirmed break above 19,516.0 with a strong close and volume. Target: 19,856.6. Stop-loss below 19,400.0.
Short Entry: If the price rejects 19,516.0, consider a short with a target at 19,146.4. Stop-loss above 19,600.0.
Monitor volume and price action near the EMA 200 for trend confirmation.
Note: This analysis is for informational purposes only and not financial advice. Adjust based on your strategy and risk management.


Bearish StructureThe NASDAQ price action shows a clear bearish Elliott Wave structure, currently unfolding a 1-2-3-4-5 pattern. Price is in the corrective wave 4, potentially reversing around the 19,371.9 area, which overlaps with a previous supply zone.
From the local high at 19,508.1, bearish momentum has increased, and we expect one final leg down toward wave 5, targeting the 19,053.1 level or even the extended 18,920 (200% Fibonacci) zone.
Key levels:
Resistance: 19,371.9
Support: 19,053.1 and 18,920
Potential strategy:
Watch for a clear rejection around 19,370–19,400 to enter short positions targeting 19,050 or 18,920. Confirm with price action.

Nasdaq100/Us100 Possible Explosive Up Move About To Happen
Hello everyone! In this idea I have posted a picture of my current setup. I have taken a long positions once the 1 hour candles broke out of and closed beyond this range (Box) My SL is just the other side of this box and I am targeting the ATH on this position.
If another 1 hour box starts to form higher up I will simple add another position and move Stop losses accordingly.
although we have moved back within the range, the buy pressure is squeezing the candles to the top side of this range. This is why I am execting an explosive move. Once sellers are exhuasted it will propell itself to the next key level.
Let me know what you think.
I am not a financial adviser. Trade at your own risk.


Staircase seen in real chartsFor the most part OANDA:NAS100USD has exhibited a near perfect staircase up so far.
It does appear fairly extended right now, but with rotation out of safe havens into risk on assets again, what remains to be seen is how much fuel is in the tank, and how far can the tailwind take it.

NY AM Silver BulletHigher TF manipulating highs, 7:30 NY high swept at 9
With MSS lower NY swing high and low after 930 and before 10am. OTE entry at 61& of Fib aligns with iFVG to sell. Moerse void below London Low.
Lower TF 5min iFVG that pushed into 7:30 high.
Entry criteria Casper Silver Buller>>$$$
