US30 – Rejection from Supply Zone! Dow Heading Lower?Timeframe: 1H | Strategy: Supply & Demand + Price Action
The Dow Jones just tagged a key supply zone near 40,965 and printed a clean rejection candle — a potential signal that bulls are losing control.
Technical Outlook:
Supply Zone (Resistance): 40,965 – 41,020
Breakdown Point: Below 40,486 = possible short trigger
Demand Target Zone: 39,938 – 40,000 (orange block)
Observations:
Price attempted a breakout but was rejected at the top of the supply zone
A clean bearish candle has formed at resistance
Market sentiment may be shifting ahead of upcoming U.S. data (see icon)
Trade Idea (Bearish Bias):
Entry: Below 40,486
Target: 39,938
Stop Loss: Above 41,020
Watch for volume confirmation and retest of the breakdown level.
Invalidation:
If price closes above 41,020 on strong momentum, the bearish setup is off the table.
Fundamental Alert:
US data/events may trigger volatility soon — watch for fakeouts or sharp reversals.
Will the Dow retrace to the 40K zone, or is this a false sell signal? Drop your view below!
Like & follow for more clean price action setups!
#US30 #DowJones #PriceAction #SupplyAndDemand #LuxAlgo #TradingStrategy #TechnicalAnalysis #Indices #BearishReversal #TradingView
US30 trade ideas

US30 – Chop or Fakeout?🔴 US30 – Chop or Fakeout? 🔴
May 2, 2025 – 1H Chart Update
After the bullish breakout above 40,700 yesterday, US30 surged to 41,051, but we’re now seeing price stalling just under that level, forming a potential double top or distribution pattern ⚠️
📊 Technical Breakdown:
🧱 Price rejected at ~41,050 (previous swing high zone)
📉 Small pullback forming after strong bullish leg
📍 Key short-term support still at 40,700
🧠 Market could be consolidating post-FOMC run or prepping for a deeper pullback
🎯 What to Watch:
Bullish Continuation Setup:
✅ Needs a 1H candle close above 41,050
🎯 Target: 42,000 → 42,359 resistance zone
Bearish Scenario:
🔻 Break below 40,700 flips structure short
🎯 Downside targets: 40,260 → 39,775
Neutral Bias If:
Price consolidates between 40,700 – 41,050 = no clear trend → stay flat

US30 (Dow Jones) Daily Analysis — Make or Break at DowntrendUS30 Daily Analysis
Technical Outlook — May 1, 2025
🔍 Current Market Condition:
US30 is trading near a critical confluence zone where price meets descending trendline resistance and horizontal supply. This level previously acted as a strong rejection point, making the current test significant.
🧩 Key Technical Highlights:
Price testing descending trendline from March highs.
Horizontal resistance zone around 41,000–41,300 is being challenged.
Stochastic oscillator is nearing overbought levels, suggesting caution.
The ascending channel’s lower boundary recently held as support near 38,000.
Compression forming between trendline resistance and rising support.
📈 Possible Scenarios:
Bullish Case:
Break and close above 41,300 could open path to retest 43,000 and 45,000 levels.
Look for a bullish daily candle with strong volume above trendline.
Bearish Case:
Rejection from current resistance could send price back toward 39,500–38,000 support zone.
Watch for bearish divergence on Stochastic or failed break above resistance.
📌 Important Note:
This week's economic calendar includes key data releases—stay alert for volatility that may trigger a breakout or reversal.
If you found this analysis valuable, kindly consider boosting and following for more updates.
Disclaimer: This content is intended for educational purposes only and does not constitute financial advice.


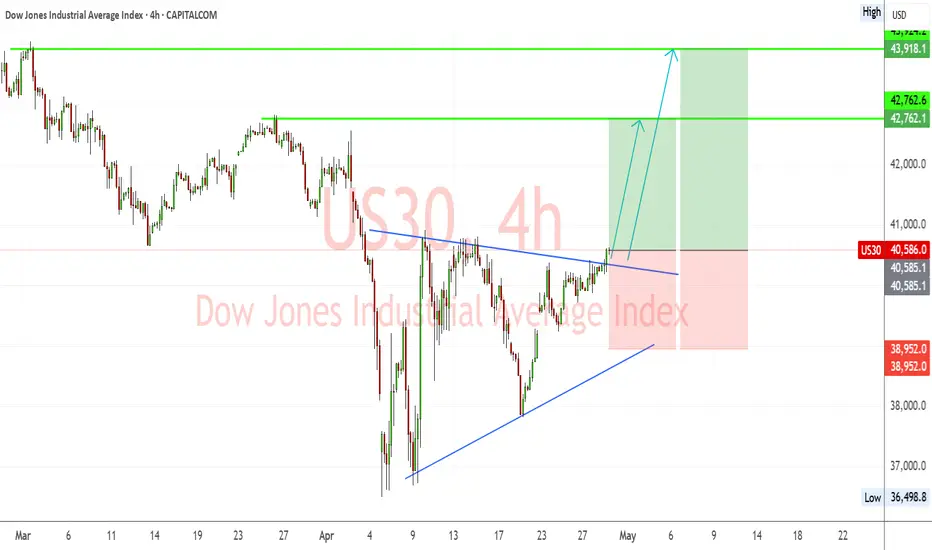
US30 Breakout from Symmetrical Triangle – Bullish Targets EyedUS30 (Dow Jones) has successfully broken out of a symmetrical triangle consolidation pattern, signaling a shift toward bullish momentum. The breakout is occurring after a strong recovery from April lows, with higher lows supporting upward price pressure.
🔹 Chart Structure:
Symmetrical triangle with a clean breakout above descending resistance.
Series of higher lows indicating accumulation.
Bullish breakout confirmed with price pushing above the 40,580 zone.
🔑 Key Levels:
Current Price: 40,586
Breakout Confirmation Level: 40,580
Immediate Resistance/TP1: 42,762
Major Resistance/TP2: 43,924
Support Zone: 38,950
Invalidation/Stop Level: Below 38,950
✅ Bullish Confluence Factors:
Breakout of symmetrical triangle pattern
Higher lows indicate bullish strength and accumulation
Momentum shift visible on lower timeframes
Positive correlation with improving US equity market sentiment
Anticipation of dovish Fed tone could boost equities
🧠 Fundamental Context:
Market is cautiously optimistic ahead of FOMC this week; dovish stance expected due to recent soft economic indicators.
Earnings season tailwinds and lower bond yields support index gains.
Ongoing political and tariff-related headlines may cause volatility, but technical breakout remains in focus.
💡 Trade Idea:
Bias: Bullish
Entry: On successful retest of 40,580 or continuation above 40,600
TP1: 42,762
TP2: 43,924
Stop Loss: Below 38,950
📌 Note: Watch for pullbacks to triangle resistance-turned-support. FOMC and US macro data releases midweek can impact momentum.
DowJones INTRADAY at pivotal zone Key Support and Resistance Levels
Resistance Level 1: 41200
Resistance Level 2: 42000
Resistance Level 3: 42710
Support Level 1: 39446
Support Level 2: 38490
Support Level 3: 37840
This communication is for informational purposes only and should not be viewed as any form of recommendation as to a particular course of action or as investment advice. It is not intended as an offer or solicitation for the purchase or sale of any financial instrument or as an official confirmation of any transaction. Opinions, estimates and assumptions expressed herein are made as of the date of this communication and are subject to change without notice. This communication has been prepared based upon information, including market prices, data and other information, believed to be reliable; however, Trade Nation does not warrant its completeness or accuracy. All market prices and market data contained in or attached to this communication are indicative and subject to change without notice.

US30: Local Bullish Bias! Long!
My dear friends,
Today we will analyse GOLD together☺️
The recent price action suggests a shift in mid-term momentum. A break above the current local range around 40,968.4 will confirm the new direction upwards with the target being the next key level of 41,302.5 and a reconvened placement of a stop-loss beyond the range.
❤️Sending you lots of Love and Hugs❤️

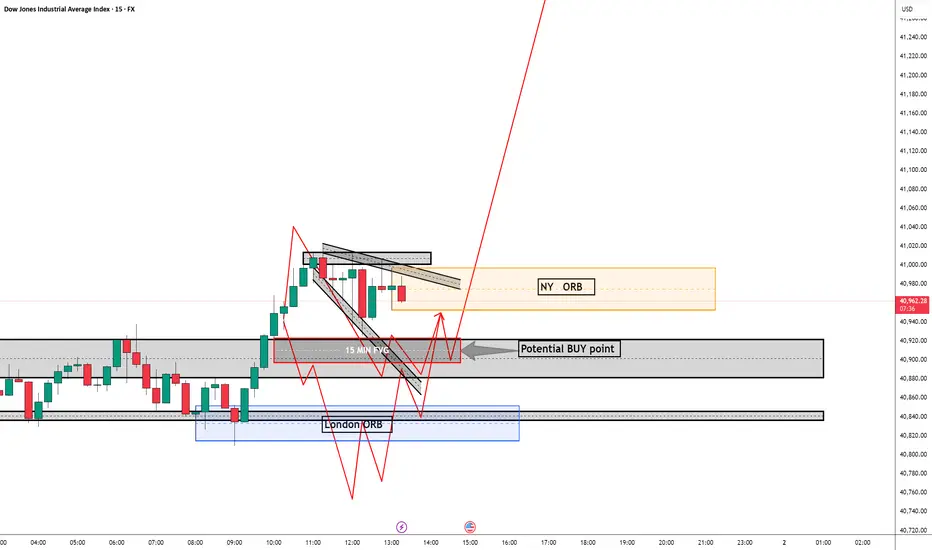
US30 (Dow Jones) Outlook – Thursday SetupWe're seeing a strong bullish push following the London Open. My expectation is for price to dip back into the London ORB zone and test one of the marked short-term demand blocks.
🔁 Play-by-Play Expectation:
Pullback to the lower OB zones and ORB.
Strong reaction from demand with bullish continuation.
Final target: top of the H1-H4 Supply Channel above 41,200–41,300 zone.
🧠 Contextual Notes:
Clean structure break post-London open.
Price filled imbalances efficiently.
Still respecting bullish internal order flow.
Clear confluence with trendline + FVG zones below.
📍 Key Zones:
Demand/Entry: ~40,840–40,760
Target Supply: ~41,250+
Invalid below: 40,643
Let the market come to your zone — no chasing. Be patient and precise. 🧘♂️
⚠️ DISCLAIMER:
This is my own analysis and I’m still learning. Please do your own research and be careful with your risk management. This is not financial advice.

US30 Breakout Confirmed – May 1, 2025 🔥 US30 Breakout Confirmed – May 1, 2025 🔥
📈 We Finally Cleared the Range!
US30 just exploded past the 40,360-40,700 resistance, tagging 40,870 with strength. This is the clean breakout bulls were waiting for — structure broke, EMAs supporting, and momentum’s on the side of the buyers 💪📊
🔍 Technical Breakdown:
✅ Clean breakout above 40,700
📈 Higher highs + higher lows confirmed since 4/19
🧠 Break + retest of 39,775 support zone last week
📊 EMAs (blue & white) strongly sloped upward = trend confirmation
🎯 Trade Ideas:
Breakout Pullback Entry:
🔁 Wait for a retest of 40,700 – 40,750
🎯 Targets: 41,200 → 42,000 → 42,359
Aggressive Longs:
Enter now with tight risk under 40,700
📍 Target next resistance at 42,359 or even 42,787 in the coming sessions
Bearish Invalidated Until:
🔻 39,775 breaks — no shorts while above EMAs + structure

"US30/DJI" Index Market Bullish Robbery (Swing Trade Plan)🌟Hi! Hola! Ola! Bonjour! Hallo! Marhaba!🌟
Dear Money Makers & Robbers, 🤑 💰💸✈️
Based on 🔥Thief Trading style technical and fundamental analysis🔥, here is our master plan to heist the "US30/DJI" Index Market Heist. Please adhere to the strategy I've outlined in the chart, which emphasizes long entry. Our aim is to escape near the high-risk YELLOW MA Zone. It's a Risky level, overbought market, consolidation, trend reversal, trap at the level where traders and bearish robbers are stronger. 🏆💸"Take profit and treat yourself, traders. You deserve it!💪🏆🎉
Entry 📈 : "The vault is wide open! Swipe the Bullish loot at any price - the heist is on!
however I advise to Place buy limit orders within a 15 or 30 minute timeframe most recent or swing, low or high level. I Highly recommended you to put alert in your chart.
Stop Loss 🛑:
Thief SL placed at the Nearest / Swing low level Using the 3H timeframe (39200) Day/Swing trade basis.
SL is based on your risk of the trade, lot size and how many multiple orders you have to take.
🏴☠️Target 🎯: 42400
💰💵💸"US30/DJI" Index Money Heist Plan is currently experiencing a bullishness,., driven by several key factors. .☝☝☝
📰🗞️Get & Read the Fundamental, Macro Economics, COT Report, Geopolitical and News Analysis, Sentimental Outlook, Intermarket Analysis, Index-Specific Analysis, Future trend targets with Overall outlook score... go ahead to check 👉👉👉🔗🔗🌎🌏🗺
⚠️Trading Alert : News Releases and Position Management 📰🗞️🚫🚏
As a reminder, news releases can have a significant impact on market prices and volatility. To minimize potential losses and protect your running positions,
we recommend the following:
Avoid taking new trades during news releases
Use trailing stop-loss orders to protect your running positions and lock in profits
💖Supporting our robbery plan 💥Hit the Boost Button💥 will enable us to effortlessly make and steal money 💰💵. Boost the strength of our robbery team. Every day in this market make money with ease by using the Thief Trading Style.🏆💪🤝❤️🎉🚀
I'll see you soon with another heist plan, so stay tuned 🤑🐱👤🤗🤩

US30 Bulls Testing Resistance – Will 40,770 Hold or Break?Price is currently testing the 40,770 🔼 resistance zone after a strong bullish push. This level has previously acted as a key ceiling and could determine the next directional move. Price has been climbing steadily with higher lows, indicating bullish momentum.
Support at: 40,194 🔽, 39,070 🔽, 36,800 🔽
Resistance at: 40,770 🔼, 41,552 🔼, 42,540 🔼
Bias:
🔼 Bullish: A clean breakout and hold above 40,770 could open the path to 41,552 and 42,540.
🔽 Bearish: Rejection at 40,770 or a drop below 40,194 could signal weakness and send price back to 39,070.
📛 Disclaimer: This is not financial advice. Trade at your own risk.


DOW JONES Are you willing to bet against a 15 year pattern?Dow Jones (DJI) will close the month today with a massive rebound 1M candle after almost touching its 1M MA50 (blue trend-line). Since the October 2010 break above the 1M MA50, after the market recovered from the 2008 Housing Crisis, the 1M MA50 has been the ultimate long-term Buy Entry as it has always signaled rallies that ranged from +58% to +67%.
The 1M MA50 has also kept the index mostly within the 0.382 - 0.786 Fibonacci range (blue zone) of the multi-year Channel Up. Given also that the 1W RSI also reached in April its ultimate Buy Zone (green), we view this as the best long-term Buy Signal the index handed to us since the September 2022 bottom of the Inflation Crisis.
Since the Bullish Legs that followed have been fairly consistent on average, we expect another 58% rise minimum. Assuming a 'bad-case' scenario of being contained within the 0.786 Fib, then a 56000 long-term Target seems more than fair.
Are you willing to go against this pattern?
-------------------------------------------------------------------------------
** Please LIKE 👍, FOLLOW ✅, SHARE 🙌 and COMMENT ✍ if you enjoy this idea! Also share your ideas and charts in the comments section below! This is best way to keep it relevant, support us, keep the content here free and allow the idea to reach as many people as possible. **
-------------------------------------------------------------------------------
💸💸💸💸💸💸
👇 👇 👇 👇 👇 👇

Hanzo | US30 15 min Breaks – Confirm the Next Bullish Move🆚 US30 – Hanzo’s Strike Setup
🔥 Timeframe: 15-Minute (15M)
——————
💯 Main Focus: Bullish Breakout at 40500
We are watching this zone closely.
———
Analysis
👌 Market Signs (15M TF):
• Liquidity Grab + CHoCH at 40420
• Liquidity Grab + CHoCH at 39870
• Strong Rejections seen at:
➗ 39900 – Major support / Key level
➗ 40300 : 40400 – Proven resistance
🩸 Key Zones to Watch:
• 40200 – 🔥 Bullish breakout level X 3 Swing Retest
• 40550 – Strong resistance (tested 5 times)
• 40200 – Equal lows
• 40420 – Equal highs


DJIA H4 | Pullback resistance at 78.6% Fibonacci retracementThe DJIA (US30) is rising towards a pullback resistance and could potentially reverse off this level to drop lower.
Sell entry is at 41,305.11 which is a pullback resistance that aligns close to the 78.6% Fibonacci retracement.
Stop loss is at 42,743.85 which is a swing-high resistance.
Take profit is at 39,324.35 which is an overlap support.
High Risk Investment Warning
Trading Forex/CFDs on margin carries a high level of risk and may not be suitable for all investors. Leverage can work against you.
Stratos Markets Limited (tradu.com):
CFDs are complex instruments and come with a high risk of losing money rapidly due to leverage. 63% of retail investor accounts lose money when trading CFDs with this provider. You should consider whether you understand how CFDs work and whether you can afford to take the high risk of losing your money.
Stratos Europe Ltd (tradu.com):
CFDs are complex instruments and come with a high risk of losing money rapidly due to leverage. 63% of retail investor accounts lose money when trading CFDs with this provider. You should consider whether you understand how CFDs work and whether you can afford to take the high risk of losing your money.
Stratos Global LLC (tradu.com):
Losses can exceed deposits.
Please be advised that the information presented on TradingView is provided to Tradu (‘Company’, ‘we’) by a third-party provider (‘TFA Global Pte Ltd’). Please be reminded that you are solely responsible for the trading decisions on your account. There is a very high degree of risk involved in trading. Any information and/or content is intended entirely for research, educational and informational purposes only and does not constitute investment or consultation advice or investment strategy. The information is not tailored to the investment needs of any specific person and therefore does not involve a consideration of any of the investment objectives, financial situation or needs of any viewer that may receive it. Kindly also note that past performance is not a reliable indicator of future results. Actual results may differ materially from those anticipated in forward-looking or past performance statements. We assume no liability as to the accuracy or completeness of any of the information and/or content provided herein and the Company cannot be held responsible for any omission, mistake nor for any loss or damage including without limitation to any loss of profit which may arise from reliance on any information supplied by TFA Global Pte Ltd.
The speaker(s) is neither an employee, agent nor representative of Tradu and is therefore acting independently. The opinions given are their own, constitute general market commentary, and do not constitute the opinion or advice of Tradu or any form of personal or investment advice. Tradu neither endorses nor guarantees offerings of third-party speakers, nor is Tradu responsible for the content, veracity or opinions of third-party speakers, presenters or participants.


Bearish drop off overlap resistance?Dow Jones (US30) is reacting off the pivot which has been identified as an overlap resistance and could drop to the 1st support.
Pivot: 40,653.80
1st Support: 39,356.30
1st Resistance: 41,490.90
Risk Warning:
Trading Forex and CFDs carries a high level of risk to your capital and you should only trade with money you can afford to lose. Trading Forex and CFDs may not be suitable for all investors, so please ensure that you fully understand the risks involved and seek independent advice if necessary.
Disclaimer:
The above opinions given constitute general market commentary, and do not constitute the opinion or advice of IC Markets or any form of personal or investment advice.
Any opinions, news, research, analyses, prices, other information, or links to third-party sites contained on this website are provided on an "as-is" basis, are intended only to be informative, is not an advice nor a recommendation, nor research, or a record of our trading prices, or an offer of, or solicitation for a transaction in any financial instrument and thus should not be treated as such. The information provided does not involve any specific investment objectives, financial situation and needs of any specific person who may receive it. Please be aware, that past performance is not a reliable indicator of future performance and/or results. Past Performance or Forward-looking scenarios based upon the reasonable beliefs of the third-party provider are not a guarantee of future performance. Actual results may differ materially from those anticipated in forward-looking or past performance statements. IC Markets makes no representation or warranty and assumes no liability as to the accuracy or completeness of the information provided, nor any loss arising from any investment based on a recommendation, forecast or any information supplied by any third-party.


Trade Idea: US30 Long (BUY LIMIT)Technical Analysis Summary
Daily Chart (Macro View)
• Price has bounced off a key support near 37,700 and reclaimed the psychological level 40,000.
• MACD is starting to reverse higher from oversold conditions, showing early bullish divergence.
• RSI is recovering from below 30, now near 49, indicating a potential trend reversal.
• Trend: Medium-term recovery from a correction; possible continuation to recent highs around 44,000.
15-Minute Chart (Tactical Entry Zone)
• Price has broken a downtrend and is now consolidating above previous resistance at 40,000.
• MACD is bullish (histogram rising), and signal lines are above zero.
• RSI at 62.6, suggesting bullish momentum but not yet overbought.
• White MA shows clear upward curvature.
3-Minute Chart (Precision Entry)
• Recent pullback retested the MA and bounced.
• RSI at 66, nearing overbought, but price is in clear short-term uptrend.
• MACD just crossed bullish again after a small consolidation.
⸻
Fundamental Context
• Recent Fed signals suggest potential rate pause or cuts, which is bullish for indices.
• Earnings season has generally surprised to the upside, especially among large caps.
• Macro backdrop: Slowing inflation + strong labor market = supportive of equities.
• Risk appetite is increasing, as seen in tech and industrials rebounding.
⸻
Trade Setup
• Position: Long US30
Entry
• Buy: 40,200 (current price action confirms upward momentum)
Stop Loss (SL)
• SL: 39,700 (below recent 15-min swing low & psychological level)
Take Profit (TP)
• TP1: 41,200 (recent intraday high and near resistance)
FUSIONMARKETS:US30

Dow Jones Swing Short IdeaComing off All Time Highs after a trump victory rally it is time for an exhausted bull market to come back and find fair value for the real bulls that buy this. the amount of greed that's sits currently in this market is to dream of for bears, and their time haas come 34500 inbound...this target should come through in the next 12month candle so its a long term leap trade.
DXY has been coming down too much, it's time to hit the kill switch on stocks and worry more on the dollar and all this inflation/tarriffs/war/ trump/ etc . DXY up = stocks down
