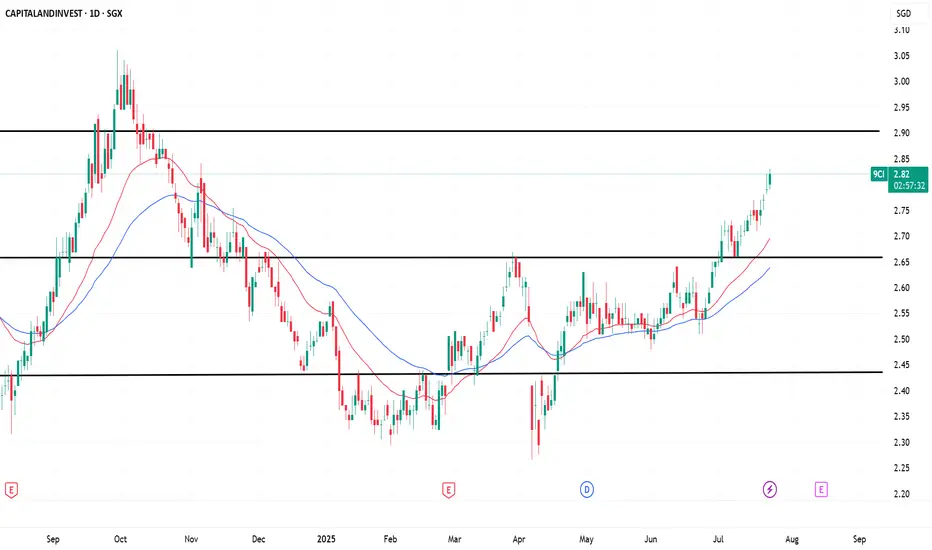
Capitaland Invest (SGX: 9CI) Uptrend – Next Resistance: $2.90Price is approaching key resistance near SGD 2.90, following a strong bullish breakout above the 2.66 support zone. A successful breakout could open the door for further upside.
Capitaland Investment Ltd.
2.09USDD
−0.01−0.48%
At close at Jul 17, 15:24 GMT
USD
No trades
Next report date
August 14
Report period
H1 2025
EPS estimate
0.06 USD
Revenue estimate
792.51 M USD
0.07 USD
350.63 M USD
2.14 B USD
4.77 B
About CAPITALANDINVEST
Sector
Industry
CEO
Chee Koon Lee
Website
Headquarters
Singapore
Founded
2003
ISIN
SGXE62145532
FIGI
BBG01337F0V2
CapitaLand Investment Ltd. engages in owning and managing real estate investment assets. It operates through the following business segments: Fee Income-Related Business, Real Estate Investments Business, and Corporate and Others. The Fee Income-Related Business segment includes investment and asset management of listed, and unlisted funds, lodging management and project management. The Real Estate Investments Business segment is involved in the investments of real estate assets and related financial products. The Corporate and Others segment refers to other real estate investment related activities. The company was founded on August 29, 2003 and is headquartered in Singapore.
−12%
0%
12%
24%
36%
H2 '22
H1 '23
H2 '23
H1 '24
H2 '24
−400.00 M
0.00
400.00 M
800.00 M
1.20 B
Revenue
Net income
Net margin %
Revenue
Op expenses
Op income
Int expenses
Non-op income/expenses
Pretax income
Taxes & Other
Net income
−400.00 M
0.00
400.00 M
800.00 M
1.20 B
Revenue
Op expenses
Op income
Expenses & adjustments
Net income
0.00
300.00 M
600.00 M
900.00 M
1.20 B
No news here
Looks like there's nothing to report right now
CapitaLand (9CI) Ready to Soar? Watch This Key Level!By Eric Lee , Sales Director of Phillip Nova
CapitaLand Investment (SGX: 9CI) has been in a downtrend since October 2024, falling from its peak of $3.20. However, recent technical signals suggest that accumulation may be taking place, with a potential breakout on the horizon. The volume profile in


CAPITALAND Investments (9C1) - BUY!BUY: $2.8 - $2.95
TP:
$3.44
$3.68
CapitaLand Investment will be a major beneficiary of lower rates from income growth for its REIT holdings and enabling accretive fee transactions. Another positive is the massive re-rating of China following the recent monetary stimulus by the central bank and su

Capitaland Investments Share Price Soars Following CLCT's 50% AcCapitaland Investments' share price surged today after its managed fund, Capitaland Integrated Commercial Trust, announced a 50% acquisition of its portfolio property, Ion Orchard. The share price has experienced two fake breakouts in the past, with the latest breakout occurring two days before the

See all ideas
Summarizing what the indicators are suggesting.
Neutral
SellBuy
Strong sellStrong buy
Strong sellSellNeutralBuyStrong buy
Neutral
SellBuy
Strong sellStrong buy
Strong sellSellNeutralBuyStrong buy
Neutral
SellBuy
Strong sellStrong buy
Strong sellSellNeutralBuyStrong buy
An aggregate view of professional's ratings.
Neutral
SellBuy
Strong sellStrong buy
Strong sellSellNeutralBuyStrong buy
Neutral
SellBuy
Strong sellStrong buy
Strong sellSellNeutralBuyStrong buy
Neutral
SellBuy
Strong sellStrong buy
Strong sellSellNeutralBuyStrong buy
Displays a symbol's price movements over previous years to identify recurring trends.
Frequently Asked Questions
The current price of CLILF is 2.09 USD — it has decreased by −0.48% in the past 24 hours. Watch Capitaland Investment Ltd. stock price performance more closely on the chart.
Depending on the exchange, the stock ticker may vary. For instance, on OTC exchange Capitaland Investment Ltd. stocks are traded under the ticker CLILF.
CLILF stock has fallen by −0.48% compared to the previous week, the month change is a 16.76% rise, over the last year Capitaland Investment Ltd. has showed a 33.97% increase.
We've gathered analysts' opinions on Capitaland Investment Ltd. future price: according to them, CLILF price has a max estimate of 3.36 USD and a min estimate of 2.37 USD. Watch CLILF chart and read a more detailed Capitaland Investment Ltd. stock forecast: see what analysts think of Capitaland Investment Ltd. and suggest that you do with its stocks.
CLILF reached its all-time high on May 18, 2022 with the price of 4.45 USD, and its all-time low was 1.51 USD and was reached on Jul 11, 2024. View more price dynamics on CLILF chart.
See other stocks reaching their highest and lowest prices.
See other stocks reaching their highest and lowest prices.
CLILF stock is 0.48% volatile and has beta coefficient of 0.75. Track Capitaland Investment Ltd. stock price on the chart and check out the list of the most volatile stocks — is Capitaland Investment Ltd. there?
Today Capitaland Investment Ltd. has the market capitalization of 10.87 B, it has increased by 1.30% over the last week.
Yes, you can track Capitaland Investment Ltd. financials in yearly and quarterly reports right on TradingView.
Capitaland Investment Ltd. is going to release the next earnings report on Aug 14, 2025. Keep track of upcoming events with our Earnings Calendar.
CLILF earnings for the last half-year are 0.02 USD per share, whereas the estimation was 0.04 USD, resulting in a −42.00% surprise. The estimated earnings for the next half-year are 0.06 USD per share. See more details about Capitaland Investment Ltd. earnings.
Capitaland Investment Ltd. revenue for the last half-year amounts to 1.06 B USD, despite the estimated figure of 1.06 B USD. In the next half-year revenue is expected to reach 792.51 M USD.
CLILF net income for the last half-year is 108.34 M USD, while the previous report showed 243.98 M USD of net income which accounts for −55.60% change. Track more Capitaland Investment Ltd. financial stats to get the full picture.
Yes, CLILF dividends are paid annually. The last dividend per share was 0.09 USD. As of today, Dividend Yield (TTM)% is 4.30%. Tracking Capitaland Investment Ltd. dividends might help you take more informed decisions.
Capitaland Investment Ltd. dividend yield was 4.58% in 2024, and payout ratio reached 125.92%. The year before the numbers were 3.80% and 338.98% correspondingly. See high-dividend stocks and find more opportunities for your portfolio.
EBITDA measures a company's operating performance, its growth signifies an improvement in the efficiency of a company. Capitaland Investment Ltd. EBITDA is 712.24 M USD, and current EBITDA margin is 33.07%. See more stats in Capitaland Investment Ltd. financial statements.
Like other stocks, CLILF shares are traded on stock exchanges, e.g. Nasdaq, Nyse, Euronext, and the easiest way to buy them is through an online stock broker. To do this, you need to open an account and follow a broker's procedures, then start trading. You can trade Capitaland Investment Ltd. stock right from TradingView charts — choose your broker and connect to your account.
Investing in stocks requires a comprehensive research: you should carefully study all the available data, e.g. company's financials, related news, and its technical analysis. So Capitaland Investment Ltd. technincal analysis shows the buy rating today, and its 1 week rating is buy. Since market conditions are prone to changes, it's worth looking a bit further into the future — according to the 1 month rating Capitaland Investment Ltd. stock shows the buy signal. See more of Capitaland Investment Ltd. technicals for a more comprehensive analysis.
If you're still not sure, try looking for inspiration in our curated watchlists.
If you're still not sure, try looking for inspiration in our curated watchlists.