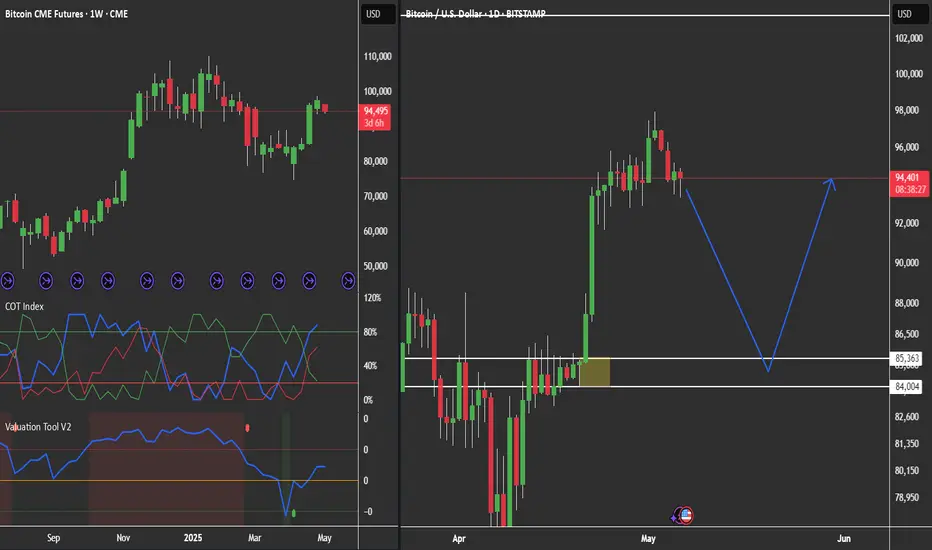
War of gapsBTC decided to fill the CME gap at 97.3k first, while the gap at 92k remains unfilled, what makes a retracement to 92k at some point still highly likely since CME gaps almost never remain unfilled.

BTC CME Gap in Play – Will It Pull Price Lower?📉 BTC CME Gap Alert
There’s a visible gap between 91,950 and 92,560—these often act like magnets, with price revisiting them more often than not. 🕳️
🔍 Why It Matters:
CME gaps tend to get filled, especially in trending markets.
🎯 What to Watch:
If BTC shows signs of weakness near local highs, a s


Bitcoin CME Futures Daily Trend AnalysisMarkets move in cycles, and different cycle durations help confirm trends ranging from short-term to long-term. Based on my analysis of the 5-day cycle, the Bitcoin CME Futures show a bearish signal. This suggests that the closing price on May 16, 2025, is likely to be lower than the opening price o


Bitcoin: Strength Within the TrendThe Bitcoin chart continues to look constructive, showing strength within a long-term uptrend that’s been in place since 2021.
🔍 While the daily chart may not tell the full story, a look at the weekly chart reveals the bigger picture:
✅ Price recently bounced off the 55-week moving average
✅ Structu

WEEKLY ANALYSIS FOR BITCOIN/BT/BTCBitcoin is one everyone's radar with analysts expecting another bullish run. Prices are definitely looking bullish and I'm on board with the thesis that new highs will soon be delivered, but for now I'm bearish on the next week and think you can enter on better prices.


From Scanner to Trade: Full Workflow GuidesFrom Scanner to Trade: Full Workflow Guides
Table of Contents
Introduction
Why a Full Workflow is Crucial for Consistent Trading
Step 1: Defining Your Edge-What to Scan For
Step 2: Setting Up Scanners in TradingView
Step 3: Filtering & Ranking Potential Trades
Step 4: Deep Analysis-

See all ideas
A representation of what an asset is worth today and what the market thinks it will be worth in the future.
Displays a symbol's price movements over previous years to identify recurring trends.
BTCK2025
May 2025DMarket open
102,870USD+0.74%
BTCM2025
Jun 2025DMarket open
103,650USD+0.88%
BTCN2025
Jul 2025DMarket open
103,375USD−1.45%
BTCQ2025
Aug 2025DMarket open
104,040USD−1.39%
BTCU2025
Sep 2025DMarket open
104,540USD−1.37%
BTCV2025
Oct 2025DMarket open
105,025USD−1.38%
BTCZ2025
Dec 2025DMarket open
105,965USD−1.39%
BTCH2026
Mar 2026DMarket open
107,610USD−1.39%
BTCM2026
Jun 2026DMarket open
109,260USD−1.39%
BTCU2026
Sep 2026DMarket open
110,910USD−1.39%
BTCZ2026
Dec 2026DMarket open
112,540USD−1.39%
See all BTC2! contracts