Market overview: China finally introduces new stimulus measuresMarket overview: China finally introduces new stimulus measures. New rises expected for oil?
Welcome to our weekly market overview.
My column focuses on analyzing the most promising stocks and futures contracts in today's financial markets. Let's discover together the most attractive investment opportunities and how to make the most of them.
We will also analyze the general macroeconomic situation and I will provide information on my open positions to share my views and investment strategies.
Macroeconomics
Despite some disappointments in quarterly results, there is a positive mood for stock markets. Wall Street continued to reach new highs, buoyed by the stability of the U.S. economy and the prospect of an upcoming interest rate cut.
Europe is enjoying the benefits of decelerating inflation and good performance by large companies, while Asia is catching up after the announcement of new support measures in China.
The ECB held a meeting but was completely eclipsed by data on U.S. economic activity. Although the central bank kept rates and its rhetoric unchanged, U.S. GDP rose 3.3 percent in the fourth quarter, exceeding forecasts of 2 percent.
This suggests that the economy may have a soft landing, as also indicated by the U.S. manufacturing and services PMIs that have returned to the expansion zone.
In addition, the risk of recession is easing further. The Future S&P 500 Mar 2024 reached new all-time highs and the yield on the 10-year U.S. bond reached a low from 4.23/25 percent.
Stocks
Highlighted this week are Netflix Inc and Tesla Inc.
Netflix overcame market doubts about its growth. The streaming giant reported a 12.5 percent increase in revenues for the quarter thanks to growth in the number of subscribers to 260 million (+12.8 percent). The company reported operating income of $1.49 billion, nearly tripling that of the previous year, and net income exploded from $55 million to $938 million.
However, Netflix's stock price is currently very high, so I do not recommend buying at these levels. Tesla is facing several obstacles at the moment. The group reported lower-than-expected fourth quarter results, with lower-than-expected sales growth and an annual decline in non-GAAP earnings.
The recall of 200,000 vehicles in the United States due to a software problem with rearview mirrors is just the latest blow to the company after a major recall just two months ago.
In addition, management's comments about profitability in 2024 and forecasts of a further decline in profitability have made the situation worse. In the near future, we may see a price decrease of up to 20 percent.
Futures
Futures in the energy and fossil fuel sector are performing well. Future Crude Oil WTI - Mar 2024 prices have been supported by encouraging economic data and ongoing Red Sea issues. Brent passed the $80 per barrel mark, while the U.S. economy grew faster than expected in the fourth quarter.
This was also confirmed by January PMIs, which exceeded economists' expectations.
In addition, U.S. weekly inventories fell significantly from consensus (-9.2 million instead of -1.2 million), providing further support for rising prices. Due to recent tensions in the Red Sea, the price of crude oil, could exceed $80.
The Natural Gas Future - U.S. Mar 2024 are trading around $2.09/MMBtu with a weekly increase of 4.4 percent, indicating a slight recovery from the previous 24 percent slump.
According to the most recent government data, U.S. utilities withdrew 326 billion cubic feet of natural gas from storage facilities last week, exceeding market expectations of 322 bcf. This was the highest weekly withdrawal since February 2021 due to strong gas demand caused by extreme cold weather.
Although storage levels are decreasing, they still remain above the seasonal average of 5.2 percent. Heating demand is expected to be low in the coming weeks due to higher-than-average temperatures until at least Feb. 7.
This situation makes optimistic forecasts for natural gas in the near future difficult. We may also see new lows in prices during this quarter, possibly falling as low as $1.60.
The value of Future Gold - Apr 2024 is stable at 2020 USD, pending the Fed's rate cut. Personally, I do not expect the Fed to cut its interest rate in the short term, so I maintain a bearish position on gold with a target at 1980 USD in the short term.
There is a technical rebound going on in the cryptocurrency market.
Last week was negative, the CME Bitcoin Future - Feb 2024 declined, dropping to around $41,000 and down more than 1 percent since Monday. The ether, on the other hand, suffered a more significant drop, falling more than 8 percent over the same period and now hovers around $2,250.
Among the reasons for the decrease in the ether's valuation is the postponement of the SEC's decision on Grayscale and BlackRock's Ethereum Spot ETFs. On the other hand, the approval of the eleven Bitcoin Spot ETFs had an effect opposite to investors' expectations.
Since the ETFs were approved on January 11, the value of Bitcoin has fallen by 15 percent, leading to an overall loss of nearly $200 billion in the cryptocurrency market. This was all predicted in my recent articles on cryptocurrency price movements.
Currently, the Bitcoin market is highly promising and I may consider buying to benefit from the possible increase in value in the second quarter.
Here are my current positions:
I have confirmed my purchase on the Hang Seng Future Feb 2024.
The arrival of effective stimulus measures in China has reinforced my bullish strategy. I am currently investing in Chinese stocks through a certificate offering an 18.5 percent annual return on two electric car manufacturers.
I have also confirmed my bearish position on gold, which is currently generating excellent profits, and a short position on the Future Nikkei 225 Mar 2024.
Given the high prices and the Japanese central bank's intention to abandon ultra accommodative policy this year, I expect a technical correction in the near future.
BTC1! trade ideas

Bitcoin ETFs now available on TV. Easy Money As Never Before 😅Bitcoin ETFs now available on TradingView
NASDAQ:IBIT - iShares Bitcoin
AMEX:BITB - Bitwise Bitcoin
AMEX:DEFI - Tidal Bitcoin
AMEX:ARKB - ARK Bitcoin
AMEX:GBTC - Grayscale Bitcoin
AMEX:FBTC - Fidelity Bitcoin
AMEX:BTCW - WisdomTree Bitcoin
AMEX:BTCO - Invesco Bitcoin
NASDAQ:BRRR - Valkyrie Bitcoin
AMEX:HODL - VanEck Bitcoin
AMEX:EZBC - Franklin Bitcoin
SEC officially approves BTC Spot ETFs
Tip #1: use TV search box to filter, find, and sort all Bitcoin funds, just like the attached screenshot.
Tip #2: use TV search box to filter, find, and sort all Bitcoin futures, just like the attached screenshot.
Tip #3: Long 1st, Short 2nd
Tip #4: Enjoy the Money 🤣🤣🤣


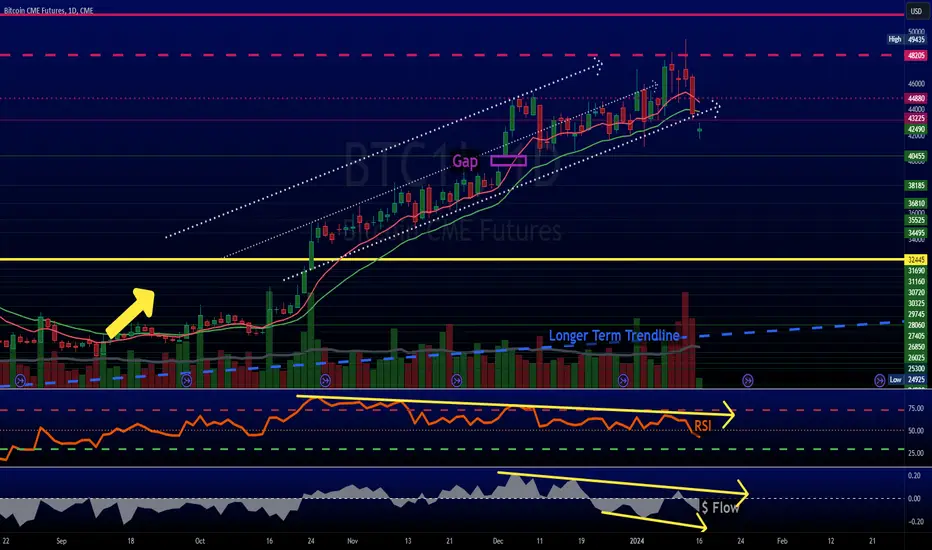
$BTC trying to find footingCRYPTOCAP:BTC will likely see 1 more dip before it resumes it's uptrend, WHY?
There is still a decent amount of bullishness out there.
HOWEVER, if #Bitcoin can do the following:
RSI hold above halfway point
$ Flow gets better, which coincides with...
Buy volume increasing
Then the drop will likely not be harsh & we could have seen the bottom,


BTC big expectancy of free fall againHello
Dear BTC buyers holders, pay attention I see that BTC has some signs of going down:
1- A strong reversal candle in weekly frametime is performing with huge voulume.
2- BTC had already accomplished its 3 correction important levels ( see my previous post) of
Fibonnacci retracement (38%, 50% and 61.8%)
3- The reached level of 48000 was expected more than 1 year as a maximum pick from where a
critical reversal point is would strat.
If BTC is agree with me it will go down until 32000 as a first .
Remember investors that I am not using a cristal ball but I try to be more rationnal whan i make my analysis.
Nb : take a look on my previous posts i listed down.

$BYC gap filled & more dataGood Morning/Afternoon Update
The CRYPTOCAP:BTC GAP was FILLED yesterday.
38k is minor support, don't expect a stand there but bounce possible.
Dotted lines are Fibonacci levels.
#BTC 37k price target very close.
#Bitcoin 32k is a stretch but anything is possible with a volatile asset.
Bearish moving avg crossover is shown by the yellow Circle
------
Shown elsewhere, see profile for more info:
A big X account speaks about positive divergence on 4hr chart.
Futures shows nothing of the sort.
Spot #BTC shows TINY divergence but NOT what should be used to trade or step in, IMO. Bounce? Maybe, we said CRYPTOCAP:BTC is at small support
Don't see any signs of turnaround for #bitcoin yet.
Sell volume is reducing, that's a +.

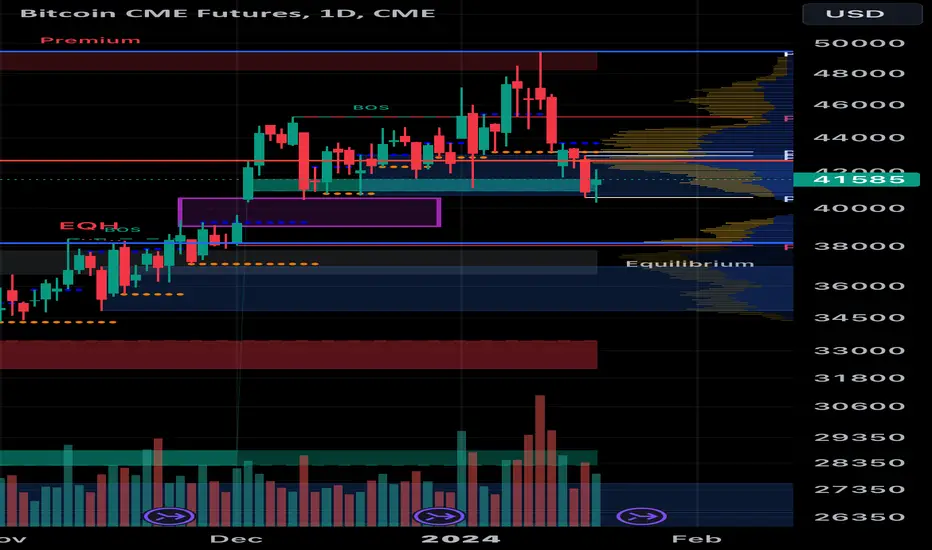
Next BTC GAP 32K -35KAfter successfully closing the gap around 40K-41K, Bitcoin (BTC) is now eyeing the next significant gap formed in October 2023. It seems likely that the price will gravitate towards the next gap zone at 32K - 35K before signaling a potential change in direction. Traders, take a moment to catch your breath, prepare your coffee, and stay vigilant. The market is dynamic, and careful observation is key to navigating the upcoming movements. Keep a close watch and stay tuned for potential opportunities ahead!

Bitcoin Weekly CME Gaps 2019 - 2024Here I've highlighted all the weekly CME gaps for Bitcion, showing all but One have now filled.
Technically, there's still one open just under $10,000 at / around $9750.
Unlikely this will ever fill at this point, but as of today Bitcoin filled the recent gap just under $40,000, which clears Bitcoin for runing higher.
However I still believe we'll re-test $38,000, followed by a bounce.
And potentially, if not likely, a deeper drop to re-test $32k before the bull run ensues.
Interesting chart just showing how often these do back-fill and re-test.

Bitcoin - Wave C is startingA lot of things about BTC is only clear in hindsight, so everyone is just predicting.
If you study Elliott Wave, the waves have so far been very perfect because BTC is a math model, but it is very hard to do it in real-time is because corrections can get complicated.
So at 48k, it is clear that price has retrace to the previous Wave 2. Unless we move up more, if not this tells us two things:
1) Nov 2021 to Nov 2022 is confirmed to be a 5-wave decline and not an ABC (big diff).
2) Wave 1 from Nov 2021 is an extension (nothing fancy about this).
These are clues that Wave C is just getting started.
Based on standard Wave C fib targets, CvsA or CvsB are unattainable as price will go negative.
The higher probability only one left is the 88.6% retracement level at 10k. 78.6% is at 16k which was already done.
Before bulls dunk on me, I am just a trader. Good if you have conviction to hold spot, but this level, it makes little sense to be long.
Never say never, because there are many unfilled CME gaps below. They may not always get filled, but mostly does.
My target is at 10k.
Just my view.


🅱️ Bitcoin Enters Correction Based On Elliot Wave Theory (~20K)➖ We have a perfect 5 up wave bullish impulse pattern.
➖ After five up we get three down (ABC).
This is the main premise for the upcoming correction, together with the halving and the Bitcoin Merge but there is more.
See this chart:
This week ended on a very strong bearish candle, we will have a closer look soon. This bearish candle/session has the highest volume since November 2022, after the week of early November 2022, the 8-Jan-2024 session has the highest bear volume on CME Futures. This is a major bearish signal.
Now we have a chance to look closer at the current week, it turns out that the CME chart reveals more data than the spot chart, this is great... Let's proceed.
Ok... Follow me!
The highest close happened 4-Dec., this is the full green candle to the left.
The top of this candle is marked with a green line.
This week we have a large upper wick (buyers buying) but the real body is red (current price below open) and the session ends red (close below open).
The candle close happened below the open and close of the first week of January and also below the close of the early December week, meaning that we have a full rejection in place.
Match this with the previous Doji (indecision), the high bearish volume (bearish strength) and wave count (market cycle), this is all pointing lower.
The fact that we have the launch of a Bitcoin Spot ETF with more hype than the Ethereum Merge, we know the top is in because these events are used to sell.
Then we have related charts such as COIN crashing and even unrelated charts such as TSLA, Gold and the SPX.
The whole thing is screaming: Down!
Now, how far low it is very hard to guess at this point because prices still trade at or near the top.
My early assessment says around 25,000 to 20,000 but soon we will have more information... The ABC wave on the chart is only for illustration, the shape of the wave and actual levels can be quite different.
The correction will last for a few months maximum, 2-4 months.
The initial reaction can be ultra-fast and strong (within 1 month).
👉 After the 2024 Bitcoin halving, we will get sustained, long-term growth.
When the halving is in, it is time to go long.
The chart will let us know and I will be here for you... You can count on my support.
You have my support.
Thank you for reading.
Namaste.


Below 40k?I'm observing Bitcoin's recent movements with a cautious eye as it teeters on the brink of falling below the $40'000 mark. I've noticed miners ramping up their selling, possibly adding downward pressure on BTC's price. While the technical indicators like the 200-day moving average show some positive signs, the overall market sentiment feels bearish. It's a tricky time, and I'm keeping a close watch on these developments, ready to navigate through this period of uncertainty and potential volatility in Bitcoin's price.

BTC - CME Chart Here is an update to this post where we predicted this move perfectly.
So far we have come up for price to fill the gap and test our old support as new resistance. If this trendline holds as resistance our technical measured move is around $38,810 even though I think we will go a little lower based on other trendline and targets.

BITCOIN GAPS IN PERFECT LOCATION!!?! Still Bullish!There are 2 gaps on the #CME that will most likely get filled.
A short move up to fill the most recent gap , then a move down to fill the gap around $39500.
This will still keep #Bitcoin in an HTF uptrend.
Calculate Your Risk/Reward so you don't lose more than 1% of your account per trade.
Every day the charts provide new information. You have to adjust or get REKT.
Love it or hate it, hit that thumbs up and share your thoughts below!
This is not financial advice. This is for educational purposes only.

Another on the $ $BTC callWe are not trying to toot our own horn with this post.
There have been a few accounts that were warning about a CRYPTOCAP:BTC top.
HOWEVER, they've been saying it for some time. Broken clock is also right daily.
We began to warn few days BEFORE the #BTC melt down.
48k target, like we stated, was likely a short term top.
We rang alarm bells on the 9th & WARNED on 11th.
Another $ call on #Bitcoin.

BTC - Short Term AnalysisOn the Left is the CME chart and on the right is a spot chart.
We did open with a gap on CME and that gap almost always get filled. That gap is between $42,365-$43,425. If price goes up to fill that gap it would also be testing our white line of old support that could be flipped into new resistance.
With the spot chart, we see BTC has created railroad tracks upon the open. This occurs when price closes and instantly reverse upon the open. Currently, we have seen these railroad tracks form on every timeframe from the 1min to the 1 week. As long as the low holds we should be able to reach the CME gap with this pattern.

🅱️ 6X Lev Bitcoin SHORT (239% Potential | Adults Only)Let's try again, the previous one was obviously too early.
These are what I call "trade-numbers".
➖ The bold levels are the first stop.
➖ It can go as low as 20K on a wick.
➖ It can take months to fully develop.
➖ Initially it can go fast.
_____
Leverage: 6X
Buy-in: $41,000 - $44,000 | Cp: $42,440
Targets:
1) $40,000
2) $37,500
3) $35,000
4) $32,600
5) $30,000
6) $27,000
7) $25,500
Stop-loss: Close daily above $46,000
Potential profits: 239%
Capital allocation: 5%
____
Disclaimer: Leverage trading is high risk and for adults only. Adults are responsible for their own actions.
Some trades can be a success (win), others can fail (a loss), this is normal.
If you cannot take a loss, then you cannot trade nor do anything in life because losing is part of the game. Making mistakes is part of the game, it is just the way we learn and grow.
I am wishing you success truly.
I am hoping you can achieve your goals.
Do your own research.
Thanks a lot for your support.
I love you 😁
Namaste.

