CNH: Chinese Currency Could Return to the 6.3-6.9 LevelCME: USD/Offshore RMB Futures ( CME:CNH1! )
Last week, I discussed how China’s huge stimulus package, coupled with the Fed’s supersized rate cut, could improve global energy demand and lift crude oil higher.
As soon as the stimulus was announced, China’s stock market staged a huge rally. The Shanghai Stock Exchange (SSE) index moved from below 2,800 on September 24th to close at 3,336.5 on September 30th, up 19% in a week. One-month return for the SSE and notable Chinese stocks are listed here:
• SSE: +17.5%
• Yonghui Supermarkets: +59.9%
• JD: +51.3%
• BABA: +32.5%
• BIDU: +25.5%
China's stock market is closed on October 1st-7th for observation of the National Day holiday. Would the China rally continue when the market resumes trading on Tuesday?
Goldman Sachs just released a research note, saying: Unless China does QE now, the current market rally will crash and burn, and the economy will be a crater. If China does do QE, oil will soar, and gold and bitcoin will be orders of magnitude higher.
While this is presented as two alternative paths, there is only one way to go, in all practical purpose. After going all out last month with unprecedented fiscal stimulus, the Chinese government could not afford to see the stock market and the housing market to tank again. It really needs to finish the job by injecting fiscal stimulus into the economy. Now that the market sensation has already turned positive, government spending would trigger consumer spending as well as investment from the private sector. Such a multiplier effect could lift the Chinese economy higher.
Everything looks bright, with one small problem: China-listed stocks are off-limited to most foreign investors due to financial regulations and the foreign currency control regime.
China’s currency could strengthen as its economy recovers
I hold the view that the China’s currency could appreciate as its economy improves. Outside of China, investors could invest in USD/RMB futures to hitch the economic hike.
To start the discussion, let’s first make some clarification to the confusing terms in the FX market. The USD/RMB exchange rate is quoted as the number of RMB per dollar. The current USD/RMB rate is 7.09, meaning each dollar could exchange for 7.09 RMB.
When the RMB appreciates against the dollar, the price quote would get lower, not higher. For example, the rate 6.50 means you now need 6.50 RMB to get one USD dollar. In RMB terms, this is 0.59 Yuan less than the current USD/RMB rate 7.09. In this scenario, the RMB gains value relative to the dollar.
While the RMB appreciation equates to the dollar depreciation, in charts, the lines representing USD/RMB and the dollar index should move in the same direction.
• For dollar index, the line moving up means dollar gaining value.
• For the USD/RMB, the line moving up means the dollar appreciating against the RMB.
• These two things usually occur at the same time.
In 2023, as China’s economy did not rebound after the end of the pandemic closedown, the RMB depreciated more than 10% against the dollar, sending the rate from 6.69 to 7.37.
In 2024, the two lines diverged due to different economic forces.
• Dollar index moves down with the market expectation of the Fed cutting rates, reducing the interest earned from holding dollar asset.
• The USD/RMB quote moves up because of the slowdown in China’s economy.
In my opinion, the two lines will converge again, both moving down in Q4. Dollar index will get lower as the Fed continues rate cuts. The USD/RMB quote will also go lower, as improvement in China’s economy would strengthen the country’s currency.
For someone with a bullish view of RMB, he could establish a short position in CME USD/Offshore RMB Futures ( NYSE:CNH ). Remember, shorting means the expectation of the quote to go lower, which actually means RMB appreciating against the dollar.
The contract has a notional value of $100,000. At Friday closing price of 7.061, each December contract (CNHZ4) is worth RMB 706,100. CME Group requires an initial margin of RMB 14,000 for each CNH contract, long or short, at the time of writing.
Hypothetically, if CNH bounced back to 6.70, its previous high in January 2023, the quote difference of 361 pips (=7061-6700) would produce a gain of RMB 36,100 (=0.361x100,000) for a short position.
The risk of shorting the CNH is that the Chinese government did not follow through with a fiscal stimulus, and the market rally is short lived.
Happy Trading.
Disclaimers
*Trade ideas cited above are for illustration only, as an integral part of a case study to demonstrate the fundamental concepts in risk management under the market scenarios being discussed. They shall not be construed as investment recommendations or advice. Nor are they used to promote any specific products, or services.
CME Real-time Market Data help identify trading set-ups and express my market views. If you have futures in your trading portfolio, you can check out on CME Group data plans available that suit your trading needs www.tradingview.com
CNHM2025 trade ideas

USD/CNH FX Futures: Yuan Bears a reflection of China's woesThe PBOC has repeatedly fixed its daily reference rate for the onshore yuan (CNY) at levels below estimates. But measures from the PBoC to support the Yuan has not been effective in changing the trend amidst a slew of economic stress (property slump, rising unemployment, deflation fears, etc) that may drive the offshore yuan (CNH) to historic lows.
The latest USD/CNY fixing on 28 August was set 989 pips below estimates, at 7.1856, the strongest level since August 15. At the same time, authorities announced a reduction of stamp duty on stock trades which served to briefly boost the yuan.
However, we continue seeing depreciation pressure for the yuan as the fundamental factors of yield differential and economic weakness have not changed.
On a fundamental perspective, we think that the PBoC does not want Yuan weakness beyond the 7.30 level for USD/CNH. But with the PBoC forced to cut rates to stimulate growth, it will continue to weigh on the Chinese currency.
On the other hand, USD strength should stick as the "higher for longer" interest rate narrative gains traction.
Unless economic woes in China improve, we see 7.5500 as a reasonable target level for USD/CNH. See trade setup below:
• Entry Level: 7.2900
• Target Level: 7.5500
• Stop Loss Level: 7.1850
• Reward: Risk Ratio: 2.46x
- Danish Lim Zhi Lin, Investment Analyst


USDCNH - Testing new highsThe trajectory of the USDCNH is a burning question as it approaches the highs witnessed in November 2022.
Recent weeks have seen China's economic robustness wane, and as a result, attempts by its central bank to ease the situation have led to a weakening of the CNH. This dynamic becomes clearer when considering the interest rate differential between China and other nations. In contrast to the U.S., which is on a rate-hiking journey, China's recent interest rate reductions have amplified the rate gap between the two nations. Overlaying the USDCNH currency pair with this interest rate differential reveals a clear correlation: as the differential grows, the USDCNH rises in tandem, driven by the depreciating CNH against the USD. A possible factor behind this movement is the "carry trade", where investors borrow in CNH at low-interest rates to invest in higher-yielding assets.
This phenomenon isn't unique to the USDCNH. Japan, another country that has adopted an easing stance, exhibits similar patterns. As the rate differential between the U.S. and Japan expands, so does the USDJPY currency pair.
Examining the dollar independently, there's potential for an upward surge. It's currently trading close to the top edge of a descending channel, with the RSI indicating it isn't oversold yet. With the Jackson Hole Symposium slated for later this week, all eyes and ears will be sensitive to any unexpectedly hawkish remarks from the Federal Reserve Chair, which could lead to another surge in the dollar, driving the USDCNH higher.
On the one hand, the dollar has the potential to break higher based on technical, on the other hand, the PBOC is likely to ease policy further as it deals with the economic fallout of its property sector. Considering the above in an eventful week when the Jackson Hole Symposium is to be held, we see opportunity for a risk managed long position in the USDCNH at the current level of 7.3126 with a tight stop at 7.245 and take profit at 7.460. Each 0.0001 per USD increment in the USDCNH future is equal to 10 CNH.
The charts above were generated using CME’s Real-Time data available on TradingView. Inspirante Trading Solutions is subscribed to both TradingView Premium and CME Real-time Market Data which allows us to identify trading set-ups in real-time and express our market opinions. If you have futures in your trading portfolio, you can check out on CME Group data plans available that suit your trading needs www.tradingview.com
Disclaimer:
The contents in this Idea are intended for information purpose only and do not constitute investment recommendation or advice. Nor are they used to promote any specific products or services. They serve as an integral part of a case study to demonstrate fundamental concepts in risk management under given market scenarios. A full version of the disclaimer is available in our profile description.
Reference:
www.cmegroup.com

The Evolution of China YuanThis video recording, a brief history of the China Yuan through these 5 stages.
My main aim is to derive the fair value of the present Yuan and into the future.
Reference for trading in CME USD/Offshore RMB (CNH) Futures
Minimum fluctuation
0.0001 per USD increment = 10 CNH
Disclaimer:
• What presented here is not a recommendation, please consult your licensed broker.
• Our mission is to create lateral thinking skills for every investor and trader, knowing when to take a calculated risk with market uncertainty and a bolder risk when opportunity arises.
CME Real-time Market Data help identify trading set-ups in real-time and express my market views. If you have futures in your trading portfolio, you can check out on CME Group data plans available that suit your trading needs www.tradingview.com

CNH: Hedging Currency Risk amid Heightened UncertaintiesCME: USD/Offshore RMB ( CME:CNH1! )
Even though the Chinese Yuan is not a component in the US Dollar Index, Dollar-Yuan exchange rate generally tracks the dollar index. If dollar gains in value, most foreign currencies depreciate against it, yuan included. When dollar is weakened, the opposite holds true. Foreign currencies appreciate relative to dollar.
However, this year the two trends diverged prominently. Dollar index was quoted 103.2 on Monday, down 0.8% year-to-date. Meanwhile, dollar/yuan rate moved up 5.2% to 7.26. A higher price quote means that yuan depreciated against the dollar.
In conventional thinking, yuan should have risen when dollar declined. The reversal of the trend could signal a major technical breakout down the road.
In the past ten years, the Yuan has been trading in the range of 6.0 and 7.3. looking back in early 2000s, the official exchange rate used to be set at a narrow band around 8.28.
Exchange Rate Key Driver: Interest Rate Parity
Let’s revisit a basic concept in economics. The interest rate parity (IRP) states that the interest rate differential between two countries is equal to the differential between the forward exchange rate and the spot exchange rate.
In plain English: An investor has the options of investing in either dollar or yuan. With higher interest rates, dollar asset will produce a higher return. To make yuan more attractive, the investor would need to get more yuan per dollar. Therefore, yuan will depreciate. This is the logic behind the IRP. It is called the Law of One Price.
Since the Federal Reserve began hiking interest rates in March 2022, the Fed Funds rate has risen 525 basis points in the following 17 months. At the same time, the People’s Bank of China cut interest rates by 15 basis points, from 3.70% to 3.55%.
• The US-China interest rate spread has widened by 540 basis points.
• If the investor held dollar denominated asset, his return would be 7.65% higher than someone holding the same asset denominated in yuan (=5.40% x (17/12) years).
• Meanwhile, the exchange rate went from 6.39 to 7.26, a 12.0% Yuan depreciation.
In this example, the IRP explains 64% of the total variation of Dollar/Yuan exchange rate. It is remarkable that fundamental economic theory works so well in the real world.
Relative Stock Market Performance
Another key factor driving capital flows in and out of China is the performance of its stock market relative to that of the global market.
China’s stock market had a good start this year. The hope of economic recovery pushed the Shanghai Stock Exchange (SSE) index up by 9%. However, economic data deteriorated markedly in the second quarter, which helped erase most of the gain.
• As of Monday, the SSE produced a meager 1.8% return YTD.
• For a comparison, the S&P was up 15.8% while the Nasdaq gained 37.8% YTD.
Relative Strength in the Economy
While interest rate spread and stock market performance drive the exchange rate trend in the short- to medium-term, the long-term value of one country’s currency is determined by the strength of its economy.
The US economy has so far managed to avoid a hard landing:
• Solid job market (unemployment rate below 4%);
• Strong GDP growth (the economy expanded from Q1 to Q2);
• Inflation getting under control (headline CPI around 3%);
• A banking crisis is contained (only a handful of bank failures);
• The debt ceiling crisis is resolved (new bill suspected the debt ceiling until 2025).
This year, China’s economic engine appeared to have lost steam.
• GDP growth slowed dramatically after a brief spike in Q1;
• Export declined by double digits;
• A gigantic housing market crisis is brewing to the boiling point;
• Debt crisis with provincial and local governments, many are technically bankrupt;
• High unemployment rates (youth unemployment exceeding 20%);
• Deflation discourages business activities and put further pressure on the economy.
Could the second largest economy in the world weather all the headwinds? This heightened risk profile warrants the need to proactively deploy risk management strategies.
Hedging for Currency Exposure Amid Rising Risk Outlooks
US-China relations remains the top geopolitical risk amid heightened uncertainties. In recent years, the relations have hit the lowest point since President Richard Nixon visited China in 1972.
While China now accounts for a smaller share of the US international trade, in 2022, both U.S. exports to China and imports from China continued to grow, according to the Bank of International Settlement data.
• U.S. exports totaled $153.8bn, an increase of 1.6% ($2.4bn) from 2021;
• U.S. imports from China totaled $536.8bn, an increase of 6.3% ($31.8bn);
• And the trade deficit with China was $382.9bn, an increase of 8.3% of ($29.4bn).
U.S. importers, exporters, and US companies operating in China all face significant risks when the exchange rate is so volatile. Some of the cost may be in one currency, while the revenue is in another. Hedging net currency exposure is key to locking in profit.
Where is the Dollar/Yuan Exchange Rate Heading?
In the previous sections, I highlighted the key drivers in the US/China currency exchange rate: relative interest rates; relative stock market performance; relative economic strength; and the state of the US-China relations.
If things are moving unfavorably for China, I could see the yuan breaking out of the recent range and going above 7.50. There are a lot of moving parts affecting the outcome.
CME Offshore RMB (CNH) is a futures contract on the Dollar/Yuan exchange rate. It has a notional value of $100,000 and is quoted as the number of Yuan per $1.
In a hypothetical case, let’s imagine that a commercial firm expects to receive 10 million yuan in six months. Should the exchange rate go from 7.26 to 7.60, the expected receipt in dollar terms would decline from $1.38M to $1.31M, down $70K or -4.7%.
The firm could hedge this exposure by buying 14 CNH contracts. The aggregate notional value is $1.4 million, matching over 10 million yuan at current market price. When yuan depreciates, futures price would go up as each dollar is getting more yuan. Therefore, when the firm loses money in business operation due to yuan depreciation, currency futures hedging would compensate for the losses.
Holding 1 CNH contract requires $21100 in minimum margin. If the exchange rate moves by 1 tick, or $0.0001, the futures account would gain or lose 10 Yuan.
A smaller firm could consider Micro RMB futures (MNH). It is 1/10 of the standard size CNH contract with a $10K notional. Margin requirement is 1/10 of the original, at $2110.
Happy Trading!
Disclaimers
*Trade ideas cited above are for illustration only, as an integral part of a case study to demonstrate the fundamental concepts in risk management under the market scenarios being discussed. They shall not be construed as investment recommendations or advice. Nor are they used to promote any specific products, or services.
CME Real-time Market Data help identify trade set-ups and express my market views. If you have futures in your trading portfolio, check out on CME Group data plans in TradingView that suit your trading needs www.tradingview.com

The case for a Weaker Yuan
The most recent Caixin Manufacturing PMI dipped below 50, landing back in contraction territory after two prints above the 50-mark. As the world's top exporter, China is acutely sensitive to fluctuations in both exports and manufacturing numbers. Historically, we've seen periods of Yuan devaluation during times of contracting Manufacturing PMI and exports as China works to invigorate export demand. With the latest PMI number trending lower, it's worth pondering whether this signals a movement toward a weaker Yuan.
A more detailed examination of Chinese economic data presents some reasons for concern. Chinese export-related economic data has collectively taken a downward turn. This could stimulate further Yuan weakening as the government strives to reinvigorate exports.
Moreover, as the world's second-largest oil importer, lower oil prices gives China additional leeway in weakening its currency, as the ripple effects of higher oil prices are tempered.
From a technical perspective, the CNH is teetering on the edge of the 200-day moving average, and prices have once more nudged above the 0.382 Fibonacci retracement level.
Meanwhile, in a shorter timeframe, we notice price action breaking out of the ascending triangle and nearing the top of the wedge pattern.
With the USD breaking to the upside coupled with the potential for a weakening Yuan, we think this makes the case for a higher USDCNH. Taking a risk-managed long at the current level of 6.9520, a prudent stop 6.8930 and take profit level at 7.0900. A Standard Size USD/Offshore RMB (CNH) Futures represents 100,000 USD. Prices are quoted in RMB per USD, each 0.0001 per USD increment equal to 10 CNH.
The charts above were generated using CME’s Real-Time data available on TradingView. Inspirante Trading Solutions is subscribed to both TradingView Premium and CME Real-time Market Data which allows us to identify trading set-ups in real-time and express our market opinions. If you have futures in your trading portfolio, you can check out on CME Group data plans available that suit your trading needs www.tradingview.com
Disclaimer:
The contents in this Idea are intended for information purpose only and do not constitute investment recommendation or advice. Nor are they used to promote any specific products or services. They serve as an integral part of a case study to demonstrate fundamental concepts in risk management under given market scenarios. A full version of the disclaimer is available in our profile description.
Reference:
www.cmegroup.com

Dollar vs Yuan Divergence US Dollar vs Yuan or US Dollar vs Offshore Yuan, technically they are establishing divergence. Above chart is my projection in time to come.
When Dollar vs Yuan moves lower, this means we are seeing a weaker Dollar and a stronger Yuan. See the following link for its video version.
The Chinese yuan, also known as RMB, is the official currency of China. It is used both onshore in mainland China and offshore in international markets.
The offshore yuan, also known as the CNH (Chinese yuan - Hong Kong), is the version of the yuan that is traded outside of mainland China. It is traded in offshore financial centers, such as Hong Kong, Singapore, and London. The offshore yuan is not subject to the same restrictions and regulations as the onshore yuan.
The main difference between the onshore and offshore yuan is that the onshore yuan is subject to capital controls imposed by the Chinese government, while the offshore yuan is not subject to these same restrictions. This means that the offshore yuan is more freely tradable and can be used for a wider range of international transactions, such as international trade and investment, while the onshore yuan is more restricted in its use.
Offshore Yuan -
Standard-Size USD/Offshore RMB (CNH)
Outright:
0.0001 per USD increment = 10 CNH
MICRO USD/CNH FUTURES
0.0001 offshore Chinese renminbi per USD
CNH Option
Google search:
USD/CNH Monthly Options Contract Specs - CME Group
Google search
Frequently Asked Questions: USD/CNH options - CME Group
Disclaimer:
• What presented here is not a recommendation, please consult your licensed broker.
• Our mission is to create lateral thinking skills for every investor and trader, knowing when to take a calculated risk with market uncertainty and a bolder risk when opportunity arises.
CME Real-time Market Data help identify trading set-ups in real-time and express my market views. If you have futures in your trading portfolio, you can check out on CME Group data plans available that suit your trading needs www.tradingview.com

Trade Data Confirms Decoupling Well UnderwayCME: Offshore RMB ( CME:CNH1! ), Micro RMB ( CME_MINI:MNH1! )
On April 5th, the Bureau of Economic Analysis reported the latest U.S. global trade data. For the first two months of 2023, total export and import were $328.9 and $489.7 billion, respectively. U.S. international trade balance was $160.9 billion in deficit.
Export growth was very strong, at 9.5% year-over-year, while import was up modestly (+0.5%). As a result, trade deficit was reduced by $25.8B from last year period.
My analysis focuses on Exhibits 14 and 14a of the report, which detail global trades by trading bloc and country in 2022 and 2023, respectively. Here are what I found:
• NAFTA: Canada and Mexico together have total trade (import plus export) of $245.6B. NAFTA is the largest US trading partner with a 30.0% share. So far in 2023, we see trading growth of 8.5% and 1.3% in share gain y/y.
• EU+UK: Total trade is $173.9B, up strongly +20.2% y/y. This is the second largest trading bloc with a market share of 21.2%, up 2.8% y/y.
• China+HK: Total trade is $98.6B, down sharply -14.5% y/y. Traditionally the largest US trading partner, China is now the 3rd largest, with a 12.0% share, down 2.6% y/y.
• India: Total trade $20.1B (-1.1% y/y) with a 2.46% share (-0.1% y/y)
• Vietnam: Total trade $19.1B (-3.0% y/y) with a 2.33% share (-0.2% y/y)
• Taiwan: Total trade $19.2B (+72.2% y/y) with a 2.35% share (+0.9% y/y)
Shifting of Global Supply Chain
The U.S. has determined to reduce its reliance on China for manufactured goods. Decoupling aims to shift global supply chain out of China. Where would they go to?
• On-shore: moving manufacturing back to the U.S. (Made-in-America);
• Near-shore: moving manufacturing to NAFTA partners Canada and Mexico;
• Moving to democratic countries with shared values, including the European Union, Asia (Japan, Korea, India, Vietnam, Taiwan) and South/Central America.
Based on BLS nonfarm payroll data in March, total employment in manufacturing sector is 12.98 million. This is 600K more comparing to March 2017 level, before the US-China trade conflict. Manufacturing jobs are coming back to the U.S.
What does the strong growth in trading with NAFTA, EU and Taiwan tell us? It shows the shifting of supply chain. This growth comes at the expense of China, which is the only major US trading partner that suffered a decline in both trading volume and market share.
Implications of Decoupling
Shifting of supply chain has long-term implications.
Bringing manufacturing back to the U.S. means job creation as well as consumption and taxes. Companies may receive government incentives to offset the cost of relocation. In the long run, getting out of the expensive cross-ocean shipping and the punitive Trump-era tariff would lower the cost of production. Near-shore production in Canada and Mexico also benefits from a more reliable supply chain and lower transportation cost.
Southeastern Asian nations have average labor cost at 1/3 or less comparing to workers of similar skills in coastal China. Vietnam and India prosper in recent years by taking production of clothes, shoes, toys, and low-end electronics away from China.
What is the implication of trade decoupling on exchange rate? It will result in devaluation of Chinese Yuan against the US dollar.
Firstly, currency exchange rate reflects the interest rate differential in the short-term.
• US Fed Funds rate is 4.75%-5.00%, and China Shibor is 1.374%;
• The Fed could raise rate again, while China’s central bank is easing to support the lackluster growth in economy. The widening US-China rate differential would cause RMB to devalue, holding all else constant.
Secondly, exchange rate represents the relative strength between two economies in the long run. Decoupling has a positive impact on US economy, but a really negative one on China.
Since China abandoned Zero-Covid policy last November, its economy has not rebounded as previously hoped. Export-oriented industries are seeing the horror of disappearing orders and clients. The housing sector, the bedrock of China’s economy, is suffering from a bust of real-estate bubble.
Dedollarization: Fact or Fiction?
Rhetoric about the pending doom of US dollar goes viral in recent weeks. While the Greenback is being challenged, no other candidate is capable of replacing it as global reserve currency.
According to the BIS, 88% of international trade was settled in US dollars in 2021. The Fed estimates that from 1999 to 2019, dollar settlement accounted for 96% of international trade in the Americas, 74% in the Asia-Pacific region, and 79% elsewhere.
IMF reports that the percentage of central bank reserve by currency in 149 countries is: US dollars, 59%; Euro, 20%; Japanese yen and pound sterling, 5% each; RMB, 3%; Others, 8%.
A global reserve currency could retain its status for well over 100 years before being replaced by another. British pound was the last reserve currency since the start of 1800s. It wasn’t until the establishment of Bretton Woods system in 1944 when the US dollar became its replacement. At that time, the U.S. has been the largest economy for forty years and held over 70% of the world’s gold reserve.
In a worst-case scenario, if an upstart currency were to successfully challenge the US dollar, its downfall would be decades away. If your investment horizon is months or years, this is not something stopping you from owning dollar.
Trade Idea
CME Offshore RMB (CNH) futures is settled at 6.8516 on Monday. The contract has a notional value of $100,000 and is quoted as the number of Chinese Yuan per $1.
The next Fed meeting is on May 2-3. According to CME FedWatch, futures traders are pricing in a 71% chance that the Fed would raise 25 basis points. If the Fed raises rate and China’s central bank does nothing, futures price shall go up by mechanical calculation.
Holding or selling 1 CNHUSD future requires HKEX:18 ,500 in minimum margin. If the exchange rate moves 1 tick, or $0.0001, the futures account would gain or lose 10 Yuan.
Micro RMB futures (MNH) is 1/10 of the standard size CNH contract with a HKEX:10 ,000 notional. Margin requirement is also 1/10 of the original, at HKEX:1 ,850.
Happy Trading.
Disclaimers
*Trade ideas cited above are for illustration only, as an integral part of a case study to demonstrate the fundamental concepts in risk management under the market scenarios being discussed. They shall not be construed as investment recommendations or advice. Nor are they used to promote any specific products, or services.
CME Real-time Market Data help identify trading set-ups and express my market views. If you have futures in your trading portfolio, you can check out on CME Group data plans available that suit your trading needs www.tradingview.com

Wandering Balloon Deflates the Rise of Chinese YuanCME: USD/RMB Futures ( CME:CNH1! )
US-China relations are arguably the most challenging bilateral relations in the 21st century. It has been in a free fall since the 2018 trade conflict. The competition has intensified and spread to investment, technology, among other arenas since then.
On November 14th, 2022, President Biden met with President Xi during the G-20 summit in Bali, Indonesia. This was expected to be a turning point to stabilize the relations.
Secretary of State Antony Blinken planned a follow-up trip to China, scheduled to depart on February 3rd. However, a massive balloon floating in the skies of Montana causes a diplomatic panic. The US alleges that it is a high-altitude military surveillance balloon from China, while China claims that it is a civilian airship derailed by wind, a force majeure accident.
Last Friday, Secretary Blinken announces the postponement of his China trip. The next day, U.S. military shoots down the balloon over the Atlantic Ocean off South Carolina.
The drama between Washington and Beijing has significant impacts over the annual $700 billion bilateral trade. Tensions could be a nightmare for tens of thousands of US companies operating in China. Today, we focus on the most prominent market risk of all, USD/CNH, the US dollar – Chinese Yuan exchange rate.
The Rise and Fall of USD/CNH
In FX spot and futures markets, USD/CNH is quoted as Yuan per Dollar. When the quote of USD/CNH rises, CNH depreciates because each dollar can be exchanged for more yuan. Similarly, a falling quote represents dollar depreciation which in turn is yuan appreciation.
How is the USD/CNH exchange rate determined? Interest rate parity (IRP) states that the interest rate differential between two countries is equal to the differential between the forward exchange rate and the spot exchange rate. The formula for IRP is:
F0=S0×((1+ ic)/(1+ib)), where:
Forward Rate=Spot Rate × ((1+ Country C’s Interest Rate)/(1+ Country B’s Interest Rate) )
The 10-Year US Treasury Yield is currently quoted at 3.623%, higher than the 10-Year Chinese Government Bond Yield of 2.934%. Plug these into the IRP formula with a spot rate of 6.792, we will arrive at a forward rate of 6.837.
Examining the 1-year price chart of CME CNH futures, we find that Yuan lost 10,000 points between March and October last year, from 6.3 to 7.3. The trend closely correlates with the Fed rate hikes. This is a vindication of sound economic theory. While China’s central bank exercises control over its currency, in recent years it adopted open market operations and phased out strong-armed government directives.
The parallel trends diverged in November, as China ended its 3-year-long Zero-Covid policy. China’s reopening becomes the main driver of USD/CNH, which receded 6,000 points from 7.3 to 6.7 in three months.
Yuan’s strengthening has been interrupted last week as the Balloon incident hits the newswire. USD/CNH lost 900 points in two days, currently quoting at 6.792.
In my opinion, as the Fed tightening cycle enters the last inning, it no longer has an overarching impact over USD/CNH. Going forward, US-China bilateral relations take over.
Bilateral relationship between the countries will remain unpredictable. This is a developing story. Will there be a strong retaliation, or a mulled response? Different actions could swing the Yuan exchange rate from one extreme to the other.
Hedging for Currency Exposure Amid Unstable Relations
US importers, exporters, and US companies operating in China all face significant risks when the exchange rate is so volatile. Some of the cost may be in one currency, while the revenue is in another. Hedging net currency exposure is key to lock in the profit.
US-China trade has been very unstable in the past few years. But overall, a “decoupling” trend has already been under way. In 2017, China was the largest US trading partner. Bilateral trade accounted for 16.9% of all US foreign trade.
The most recent data for the first 11 months of 2022 shows a different story now:
• Canada is the No. 1 US trading partner with $733.1 billion and a 14.9% share
• Mexico is the 2nd largest, with $718.3 billion (14.6%)
• China is now only the 3rd largest with $639.5 billion and a 13.0% share
The US has become less dependent on China in its global supply chain. This is evident by the huge growth in bilateral trades with Vietnam (+122%), Taiwan (+102%) and India (+89%) in the last five years, while China trade only managed to grow 2%.
Short-term Trades May Prevail
In “Year of the Rabbit: Short-tailed Trading”, I discussed my preference for short-range trading this year over longer-term holding done in the past year. Market uncertainties pose more challenges in analyzing multiple moving targets with uncharted trajectories.
The Chinese currency is exactly what I am talking about. Just when you think China’s reopening would induce a secular bull run, a wandering balloon out of the blue sky deflates that hope. I would not be surprised if we have a repeat of the 2018 Trade Conflict. When the tension between the two superpowers intensifies, it could swing the market wildly.
For readers who have followed my stories, once again, we could leverage the game theory and event-driven strategy in response to this unexpected market event. In the past few years, I have deployed game theory and strangle options across a number of highly volatile and uncertain market scenarios, upon US-China Trade Conflict, the Russia-Ukraine Conflict, the Fed Rate Hikes, the US Midterm elections, and the US Debt Ceiling Showdown. Most of these ideas have been published on TradingView. You will find links to these stories at the end of this report.
While there isn’t an option contract available on the CNH, short-term trade on the currency futures contract may be considered.
Take the balloon incident as an example: Do you think Beijing will retaliate or merely protest in words? The former could worsen the US-China relations, and in my view, push the value of the Yuan down. The latter indicates the conflict can be managed without getting out of control, which is good news for the Yuan.
In summary:
• Hawkish response – Yuan value Down and CNH futures price Up;
• Dovish response – Yuan value Up and CNH quote Down
Once you form an educated opinion on which action is more likely, consider placing a long (hawkish) or short (dovish) futures position accordingly. Then hold on for the events to unravel. If history is any guide, the market often tends to over-shoot in response to overreaction.
Happy trading.
Disclaimers
*Trade ideas cited above are for illustration only, as an integral part of a case study to demonstrate the fundamental concepts in risk management under the market scenarios being discussed. They shall not be construed as investment recommendations or advice. Nor are they used to promote any specific products, or services.
CME Real-time Market Data help identify trade set-ups and express my market views. If you have futures in your trading portfolio, check out on CME Group data plans in TradingView that suit your trading needs www.tradingview.com

The Rise and Fall of Chinese YuanCME: USD/Offshore RMB ( CME:CNH1! ), COMEX: Copper Futures ( COMEX:HG1! )
Two weeks ago, China abruptly overhauled its strict Covid policy that had been in place for nearly three years. Lockdowns, health codes, massive testing, and domestic travel restrictions are no longer enforced. “The world changed overnight,” said one of my friends.
From Zero-COVID to “Lying flat”, the literal translation of a Chinese term which means doing the bare minimum to get by, this is a 180-degree policy reversal. It brought overwhelming joy and fear at the same time. People rejoiced over a long-overdue normalization of life and work but feared for surges of widespread Covid infections. I am sending my prayers and hope that a weaker Omicron virus would result in less severe health issues.
China’s reopening could have significant implications to its economy and to financial markets. Today, I focus on its currency, its stock market, and the global commodities markets.
The chart above illustrates how the Chinese Yuan (aka RMB) has moved up and down during the 2-year trade friction and 3-year Covid:
• In 2018, President Trump imposed import duties on thousands of goods originated from China. This sparked a Tariff War that met with retaliation from China.
• As tension escalated and tariffs raised from both sides, the USD/RMB exchange rate depreciated 12%, from 6.28 in March 2018 to 7.16 in December 2019.
• After nearly two years, the two countries signed a First Phase Trade Agreement in January 2020. The Yuan rallied 4% to 6.87.
• Two weeks later, Covid broke out in Wuhan, the capitol city of Hubei Province in central China. It shocked the world. As the pandemic quickly spread all over China and to the rest of the world, RMB depreciated back to 7.16 in May 2020.
• As China’s Zero-Covid policy quickly restored its manufacturing, the “World’s Factory” ramped up exports to other countries which were still shut down by the pandemic. The Yuan rallied again, all the way back to 6.3 by February 2022.
• The citywide lockdown in Shanghai, China’s largest city, was a turning point. Yuan nosedived to a record low of 7.3.
• Finally, the opening of Chinese Communist Party (CCP)’s 20th Congress in October and November signaled a change of courses. With Zero-Covid ending a month after, the Yuan is now back up to around 6.95.
In my view, China’s relations with the West are the key driver of RMB/USD exchange rate. When China embraces the world, Yuan goes up. When it decouples from it, Yuan goes down. As the time of writing, RMB has rebounded 5% in 2 months. I expect Yuan to further appreciate in 2023.
China’s Stock Market
China’s Shanghai Stock Exchange (SSE) index moved sideways. The five-year cumulative return is -7%. This highlighted the severe impacts delivered by both the Trade friction and Covid on the Chinese economy. By comparison, the S&P 500 yields +80% for the first four years. Even after the big selloff in 2022, its 5-year return is +45%.
We are witnessing initial chaos from reopening and Covid surges. After time goes by, I expect China’s stock market to rebound in 2023. For certain, the Chinese economy faces a lot of headwinds. However, massive bailout from the State is on its way. Next year is a year for stock picking. State-run enterprises are in a better position to receive government stimulus disproportionally. My suggestion is to follow the money. Keep an eye on industries and companies which benefit the most from State economic policy.
Commodities Will Get a Lifting
China’s reopening is welcoming news for commodities. Take CME Copper Futures (HG) as an example. Since the past summer, the base metal had been beaten down by 20% amid the market fear of recession. However, it moved above its 50-day MA in November, as the end of CCP’s 20th Party Congress signaled changing courses.
I am also bullish for agricultural commodities. With people going back to work and regaining income, consumption for corn, soybean, wheat, pork, beef, and poultry shall increase next year. This is good news for big exporters such as the US, Brazil, and Argentina.
Takeaways:
1) CME CNH Futures may continue to pull back due to US dollar softening and China reopening. Please note that CNH is quoted RMB per USD. If the Yuan appreciates against the Dollar, futures price would fall. Therefore, if you are bullish on Yuan, shorting CNH is the proper action.
2) SSE stock index may rebound, but we are better off picking individual stocks benefiting from government stimulus. For investors who can’t trade China’s stock market, you could search for Chinese companies listed in Hong Kong, or their American Depository Receipts (ADR) listed in the US markets.
3) Copper (HG) continues to weigh in between demand reduction from global recession and potential demand increase from China’s reopening. In my opinion, recession has already been priced in. The end of Zero-Covid would be an extra booster. Copper could erase its 2022 loss once China factories are pumping out products once again.
I wish everyone a Happy New Year.
Disclaimers
*Trade ideas cited above are for illustration only, as an integral part of a case study to demonstrate the fundamental concepts in risk management under the market scenarios being discussed. They shall not be construed as investment recommendations or advice. Nor are they used to promote any specific products, or services.
CME Real-time Market Data help identify trade set-ups and express my market views. If you have futures in your trading portfolio, check out on CME Group data plans in TradingView that suit your trading needs www.tradingview.com

As policies continue to diverge…For readers who have been following us right from our first ever TradingView idea, you’ll recall our first ever trade idea on long USDCNH. It’s been a fun 5 months writing and sharing our thoughts with the community.
Much has happened since April, but two critical things stayed the same. The US Federal Reserve remains hawkish, raising rates, while the PBoC remains dovish, continuing with its easing stance. The result? USDCNH trading beyond the 6.9 level, surpassing both our target levels.
With the next Federal Reserve meeting coming up, we think it’s time to review this idea again. The CME FedWatch Tool allows us to gauge what market participants are expecting the Fed to do. The prevalent consensus seems to be that the Fed is likely to raise rates till the end of the year before holding rates at the 3.75 – 4.00 % level for the next year.
On the other hand, the PBoC has continued to ease, cutting reserve requirement ratios & lowering its medium-term lending facility. With China still battling Covid via lockdowns, persistently low inflation numbers, and weak economic numbers, we see further easing on the cards from PBoC.
Looking at the charts, the USDCNH pair has just completed a symmetrical triangle chart pattern. After breaking out to the upside and a brief pull-back, prices continued upwards with strong momentum. Using classical charting techniques, the target levels for the breakout can be set to the distance of the high and low of the symmetrical triangle and applied to the top of the triangle. With the target price of 7.1180, there is still upside for this trade.
It seems that policy divergence will remain for these two major economies, which is likely to strengthen the USD and weaken the CNH further, driving up the USDCNH pair. Using technical to identify target levels where we will be comfortable, we think that there is room for more upside.
Entry at 6.9500, stop at 6.8545. Target at 7.1180.
The charts above were generated using CME’s Real-Time data available on TradingView. Inspirante Trading Solutions is subscribed to both TradingView Premium and CME Real-time Market Data which allows us to identify trading set-ups in real-time and express our market opinions. If you have futures in your trading portfolio, you can check out on CME Group data plans available that suit your trading needs www.tradingview.com
Disclaimer:
The contents in this Idea are intended for information purpose only and do not constitute investment recommendation or advice. Nor are they used to promote any specific products or services. They serve as an integral part of a case study to demonstrate fundamental concepts in risk management under given market scenarios.
Reference:
www.cmegroup.com

Strong performance of TRUMP2024 vs SP500Since the Joe Biden election, the TRUMP2024 token has been on a tear.
From this chart, we can see the markets are lagging a lot, taking time to react to events : It took nearly 6 months of Joe Biden presidency for the markets to realize the potential of the TRUMP2024 token vs the SP500 under Joe Biden's policy.
For the future, we expect TRUMP2024 to continue building momentum as the 2024 US elections get closer and closer.

Hawks vs Doves, the battle of CNH…CNH1!
Birds of different feathers are likely not to flock together! As policy divergence continues between the US Fed (Hawkish) vs the PBoC (Dovish), we expect the Dollar to strengthen against the RMB on a macro level.
On the technical side, we see a bullish RSI divergence (prices making lower lows while RSI making higher lows), suggesting that momentum is nearing the end and potentially reversing. We also note proximity to the long-term support level since 2014 as an additional bullish factor.
Entry at 6.355, stop at 6.2955. Targets are 6.580 and 6.720.
Disclaimer:
The contents in this Idea are intended for information purpose only and do not constitute investment recommendation or advice. They serve as an integral part of a case study to demonstrate fundamental concepts in risk management under given market scenarios.


the deflationary cat is out the bagwhat does it means. this is extremmmmmely bad. a demand shock heard around the currency world.
monetarily the pboc is at their limits... internal inflation is looking incredible unstable in the mainland..
lets see if china is a reflection of what may come to the us?


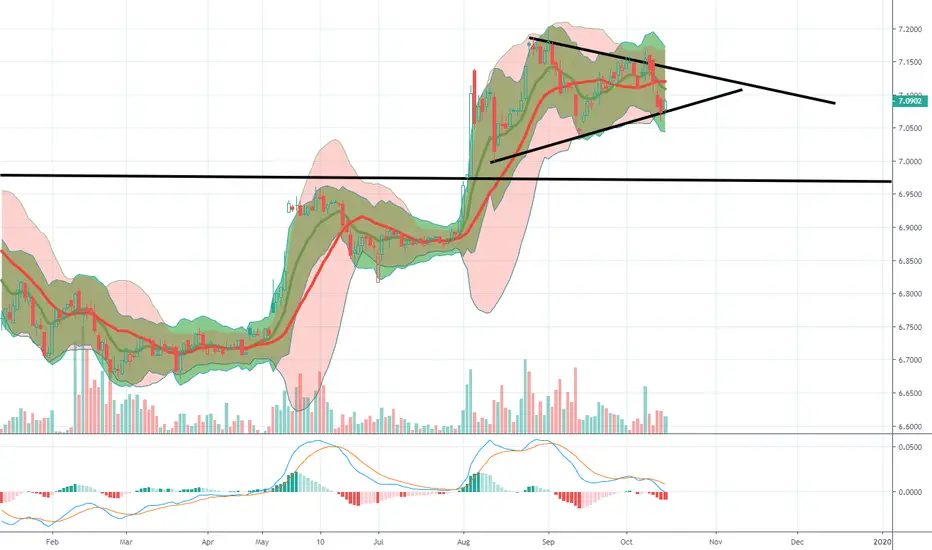
Risk assets watch the thin red line7.0 is the line in the Sand. All risk assets watching for the main question on all our minds.
Inflation or deflation. I haven't been this excited since team Edward vs team Jacob. Obvious long oil I'm team inflation. In order to see this play out gyna needs to see their currency vs the dollar below the 7.0 line


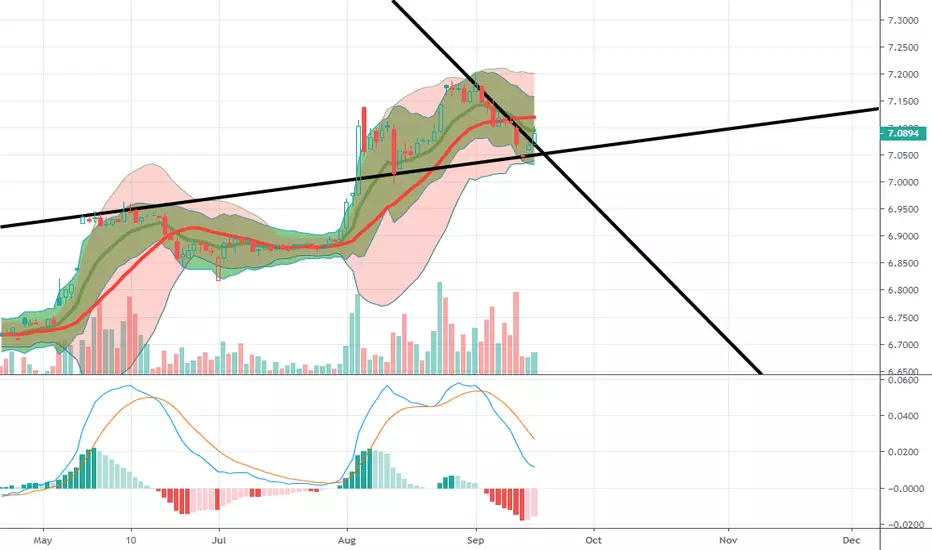
speculators vs central bankers round? cpi and ppi showing exactly what ive been saying for months. when you devalue your currency you import inflation and export deflation. industrial production, gdp... etc coming up. the question is.
can china keep a lid on inflation and a forced devaluation? i say Pandora's box is in a precarious position