ETHGot some gaps above to fill mate. So far Uptober has been 48 hours of chop and slow bleed into weekly close.. selling pressure creates long liquidity as they say. Liking probability these gaps are filled this month and then some.
MET1! trade ideas


ETHCME filling 1266 now (finally). That's all gaps below filled. There are gaps immediately above up to 1494 created in the last week that I'm looking for them to fill on a bounce from ~here.
Also worth noting that 1266 was filled on the Autumn Equinox, which makes it an even likelier potential inflection point.


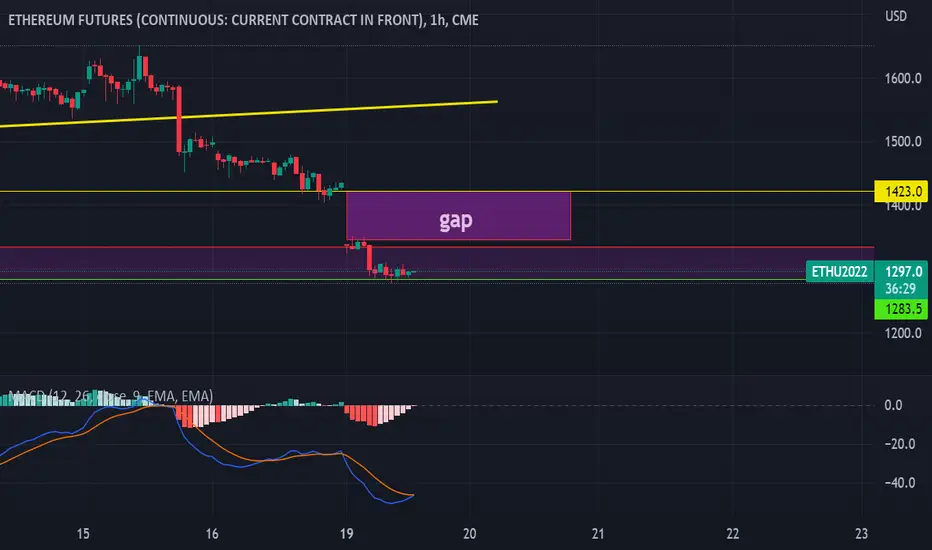
Ethereum about to close gap at $1,266ETH CME future
Ethereum about to close gap at $1,266 - might be a huge support for recovery IMO
Next lower supports $1,227 (FIB retracement) and $1,080 (volume profile)
Don't be in any fear... dear Crypto Nation 😎
Comments & FOLLOW appreciated
*not financial advice
do your own research before investing


ETH only major Crypto that is fighting BEAR$ETH still WITHIN parameters of INVERSE HEAD & SHOULDER pattern = END OF BEAR
BUT
Needs to BREAK above NECKLINE with VOLUME
Short term, as stated not long ago, #ETH GAP FILL likely
Oversold may also happen
#Ethereum still way better than $BTC (only RSI showing signs of life)


#Ethereum #ETH - looks like bearish confirmationETH might confirm the rising wedge breakout and start another leg down
But we have an invalidation point at $1,672.5
Fingers crossed for all ETH HOLDERS, dear Crypto Nation
Comments & FOLLOW appreciated 🤗
*not financial advice
do your own research before investing


Hello WorldHello, world!
I think it's time to get meet.
I see the true trading volumes of the markets.
At what point in time did someone buy or sell
How big is the position of a major player the average price of his entry and the moment he exits the market
I literally read the market. And I see its essence.
Predicting movements is a thankless and foolish business. Nobody knows the future. NO ONE
It's much more important to see the present, the point at which everything will change.
Turning points .
Right now, I see trend changes in the most liquid indices and crypto stocks.
Follow me and I will show you the truth
Let’s starts
I transferred the data on entry and exit of trades to the ETH chart
entry on July 08, 2021 to short position from 2411 - exit on July 21, 2021 at 1781 - profit 26.09%
entry on July 21, 2021 to long position from 1781 - exit on September 7, 2021 at 3727 - profit 109.51%
entry on September 7, 2021 to short position from 3727 - exit on September 30, 2021 to 3012 - 19.40% profit
entry in long position on September 30, 2021 from 3012 - exit on October 21, 2021 from 4104 - profit 35.92%
entry in deal on October 21, 2021 short from 4104 - exit on February 24, 2022 by 2563 - profit 37.54%
entry in trade on February 24, 2022 long from 2563 - exit April 1, 2022 at 3500 - profit 36.71%
entry in deal on April 1, 2022 to short from 3500 - exit on May 26, 2022 by 1848 - profit 47.28%
entry in long position at 1848 on May 26, 2022 - exit on June 1, 2022 at 1895 - profit 2.87%
entry in the deal on June 1, 2022 short from 1895 - exit on June 21, 2022 at 1133 - profit 40.24%
buy entry 21 June 2022 long from 1133 - exit 19 August 2022 at 1776 - profit 56.52%
entry in August 19, 2022 short - trade opened at the moment
You can see the result
412% in 14 months - which is a very decent result
I will try to publish the information about the changes in my trading position on the day when it changes
or with a slight delay

Ethereum CME Future - gap & volume profile updateEthereum CME Future - gap & volume profile update
We have a new small gap where ETH price could not break gap resistance at $1,624.5
If current volume support at $1,493.5 does not hold... a lack of volume might bring prices down to the gap support at $1,359.0 quite quick
Will keep you updated dear Crypto Nation
*not financial advice
do your own research before investing

ETHHELLO GUYS THIS MY IDEA 💡ABOUT ETH is nice to see strong volume area....
Where is lot of contract accumulated..
I thing that the Seller from this area will be defend this SHORT position..
and when the price come back to this area, strong SELLER will be push down the market again..
DOWNTREND + Support from the past + Strong volume area is my mainly reason for this short trade..
IF you like my work please like share and follow thanks
TURTLE TRADER 🐢

Ethereum ETH at critical support border of rising wedge !!!Ethereum at critical support border of rising wedge !!!
As many other cryptocurrencies ETH is in a rising wedge that is typically a bearish pattern
Right now we are at critical levels on price chart and RSI again - exciting hours are imminent dear Crypto Nation
Will keep you updated
*not financial advice
do your own research before investing


#Ethereum CME Future - gap update and volume profile #ETHThis chart shows how perfect the prices react when they reach important volume profile levels
Day is not over but it seems we get a Hammer candle
If so the Friday before weekend will get quite interesting - maybe we see some profit taking
I will keep you updated dear Crypto Nation
*not financial advice
do your own research before investing

ethusd rising wedge broken. Ethereum below 1000 in SeptemberBearish flag rising wedge on #ethereum shows that we are in crucial point.
The invalidation will be touch and break 2200. Very unrealistic, only if CPI tomorrow would be below 0 - no inflation anymore.
We will see soon 1000 and lower ether till September ending in another -50% crush of all Cryptocurrency market.
I expect crush, taking into account that in September there will be a milestone change in cryptocurrency world - #Ether goes PoS and miners earning by PoW mining will lost almost 50% of their income being forced to sell their mining hardware, fire personal, sell mined coins and most of them liquidate their business.


#Ethereum CME Future - perfect price reactions #ETHEthereum CME Future - perfect price reactions at volume profile
This could be seen on the predicted volume resistance and on current daily candle
The daily close will be very important - maybe we see a nice Hammer or Doji
Bulls will hope for magnetic CME gap attraction at $2.594 - $2.677
$1.565 is the next lower volume profile support dear Crypto Nation
*not financial advice
do your own research before investing

