M2K1! trade ideas
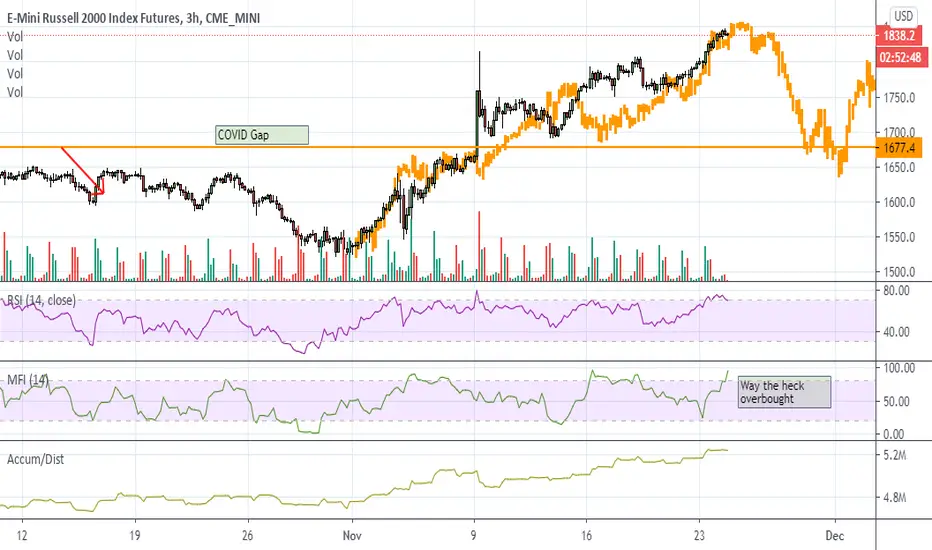
RTY - Up, Up and .... This four hour chart has the answer.
When this trend line breaks - which looked like it was today - but not just yet.
Suspect this will be violent. However timing this is tough ( I have been wrong on this one) - best watch for trend line break . They will prop this up as long as "big money'"chooses, that's clear.
The USD falling really is responsible for this rally - the DXY is at levels not seen since April 2018. When its decided to reverse the USD the rally is done. Watch for divergences in the Euro - this may tip us off.
IWM calls made up 24% of the option volume and puts made up 76% of the volume today. The Commitment of Traders show that commercials are very short and large speculators as well as retail are very long as of last Friday.


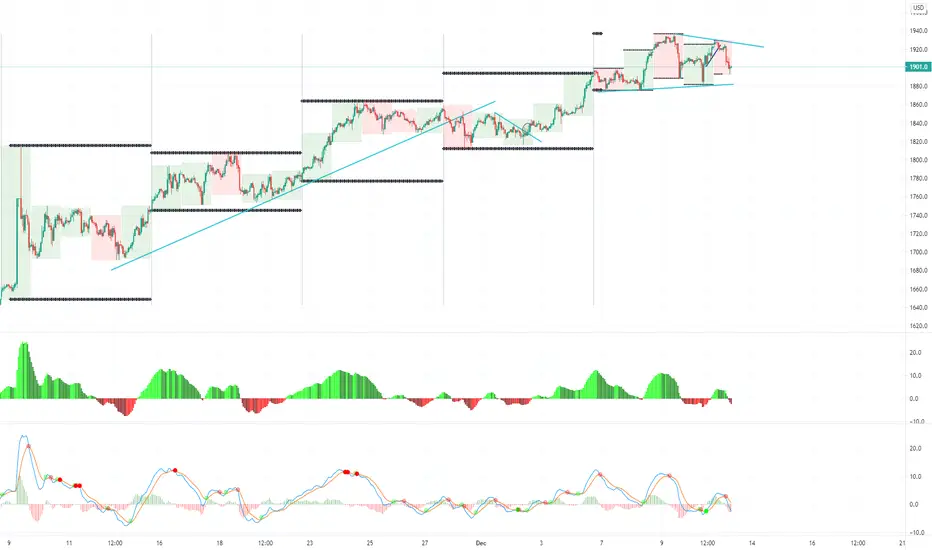
RTY [$IWM] | One Last Push to All Time Highs Before A CorrectionPrice broke out from a bearish ascending channel and has since been consolidating within a bullish flag
A break out of this bull flag should push price higher (~$1900) where it will likely find resistance.
I will look for short opportunities around the ~$1900 psychological level and/or wedge retest.
Upside targets: $1880, 1890
Downside targets: $1850, $1810, $1750


ES and RTY consolidation targetsES / SPX
ATH gives a bullish stance but looking for a correction / more consolidation first.
Looking to retrace to first stop @ 3630
POC for the current run up from 02 Nov 2020 is @ 3560
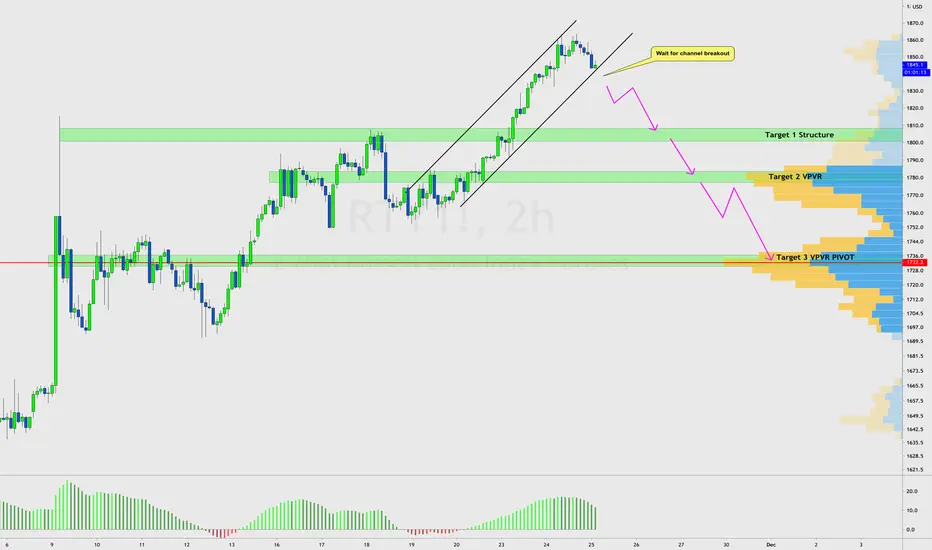
RTY / RUT
Consolidating below POC, if there is a close below 1822 a retracement to VPVR nodes is likely
First Retracement to 1800 (weak support) then to the next much more solid node @ 1780
A close above current POC of 1845 will generate a probable break of ATH


Russell 2000 future trendline Right at weekly trendline resistance now. Interesting to see what happens next.
Disclaimer, this is only for entertainment and education purposes and doesn't serve by any means as a buy or sell recommendation.
Personally I hold both long term long positions and occasionally short term short position, for disclosure purpose.


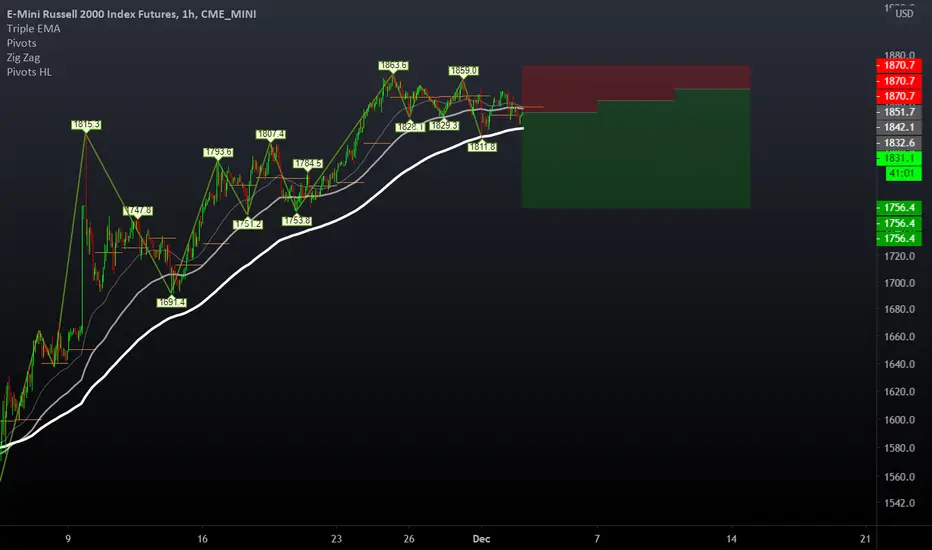
RTY IWM RUSSEL 2000 short , early positionRUSSEL 2000 gettin overbought due to sector heavy rotation of last weeks. Possibility to open a entry position here and scale in if it breaks down below 1815$. Average down if market push up higher or use SP500 as reference for stop loss. Shorting is super tricky and it's impossible to time them perfectly. This is a counter-trend play, so very risky. Regression to 20ema should be achieved before another push up.
PT1:1815 (small pullback)
PT2:1753 (retracement)


