RTY - May/June overlayOverlayed the May/June rally to see where we're at....
Take it for what it is.... not suggesting a huge dump will happen next week....
M2K1! trade ideas


Long RTY / Short ESIf we're above these levels I gotta consider adding something like this position. Just a lil bit. And ease in more if it's working. RTY/NQ is also looking like a massive base is forming, but I feel like it will take more time to heat up. At any rate, at some point this train is leaving the station. Just don't want to be too early or too late.

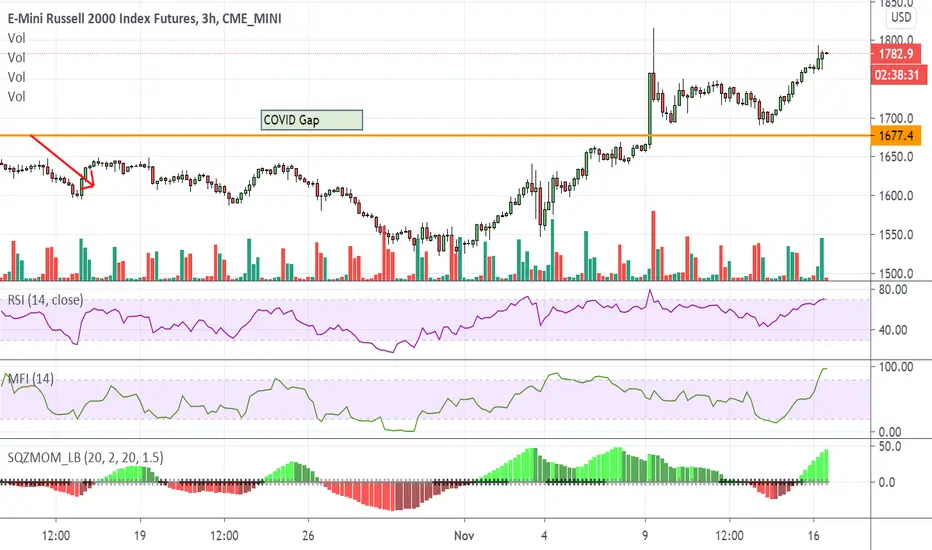
Russell Version to the Mean
Continuing my idea from yesterday - multi day picture shows whats been going on.
Interesting is the volume profile - or rather the lack there of - this a one hundred point plus move that was initiated before the latest vaccine news.
Lots of measurable divergences - but the forces that be are keeping this up - the cumulative deltas have gone negative.
Look forward to seeing this return to the mean.


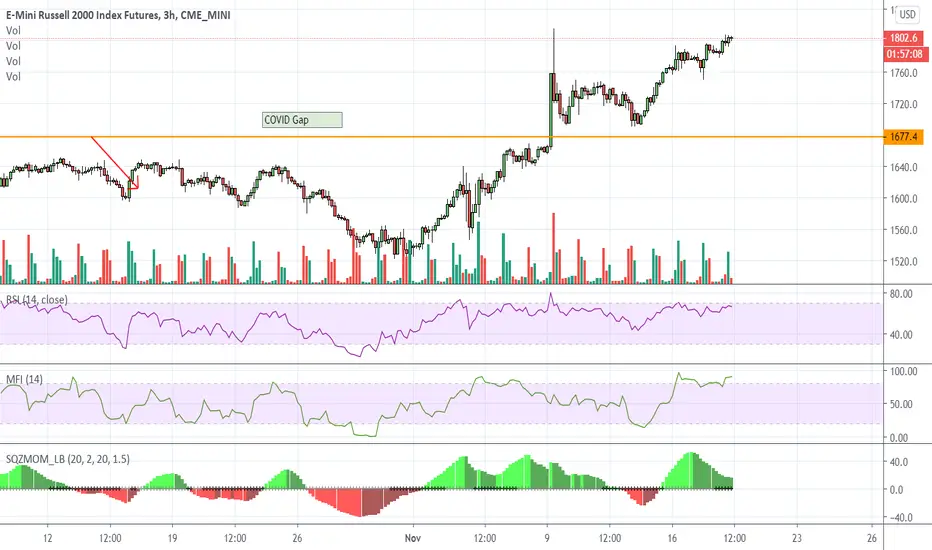
Russell Back Test
I monitor to RSI of bunch indexes using TV alerts - last night RTY was under 25% - and now it just turned to 75% as I'm typing.
However this looks like a back test before we move lower, impressive ranges in the Russell - its moving as much as the /ES on daily basis.
Good dose of divergence at this point which is outlined in chart.
Naked VPOC at 1744 that needs visiting - that's 40+ lower.