Russell Futures ( RTY1! ), H4 Potential for Bullish ContinuationTitle: Russell Futures ( RTY1! ), H4 Potential for Bullish Continuation
Type: Bullish Continuation
Resistance: 2033.0
Pivot: 1909.8
Support: 1832.2
Preferred case: Looking at the H4 chart, my overall bias for RTY1! is bullish due to the current price being above the Ichimoku cloud , indicating a bullish market. Expecting price to retest the pivot at 1909.8, where the overlap support is before heading towards the resistance at 2033.0, where the previous swing high is.
Alternative scenario: Price could head back down to break the pivot at 1909.8, where the overlap support is, before heading towards the support at 1832.2, where the previous swing low and 38.2% Fibonacci line is.
Fundamentals: There are no major news.
RTY1! trade ideas

Russel to $2000 near Feb 3We have a clear 5th wave in progress.
The 5th wave will complete the A-B-C zigzag, where wave C is a slightly less aggressive slope than wave A, as is usually the case for a Elliott zigzag
Blue Line from wave 2-4 cloned and placed atop wave 3 shows the end of wave 5
Wave 5 / Wave C end near the 100% extension of wave A
The end of blue line for wave 5/C ends Feb 3 which coincidently is a Friday.

RTY chart, held support where it had toRTY chart, held support where it had to, at the must-hold resistance now
There is a pathway for the overshoot/fake-out move I mentioned before; there is time till the Fed meeting.
Its at a perfect r/r for a swing short.
I might post one more chart tomorrow.
Good night

When downside volatility becomes an advantage.It’s been a while since we looked at the Russell 2000. For the uninitiated, the Russell 2000 index is a small-cap stock market index that is made up of the smallest 2000 stocks in the Russell 3000 Index.
The small-cap nature means a few things, volatility tends to be higher for one. And capturing this downside volatility using the Russell 2000 as compared with the S&P 500 has almost always proven more fruitful.
When to take this trade you may ask? The recession bellwether indicator of the 2Y – 10Y yield spread is a simple place to start. With the benefit of hindsight, shorting each of the indexes at the peak ‘inversion’ points proves to be a decently successful strategy. Especially so using the Russell 2000.
So the next question to ask is if we are near the peak point of inversion?
To answer this, we have to circle back to research from last week, where we discussed the expected rate path for the Federal Reserve (Fed).
In short, markets seem to be pricing in a Fed pause, followed by a pivot in the coming year. Looking back at the charts, this shift in stance (or pause) highlighted in the top chart generally marks the turning points for the 2y-10y yield curve inversion, highlighted in the bottom chart. Therefore, with markets expecting a pause as early as the first quarter, we suspect that the turning point for the yield curve inversion is just around the corner.
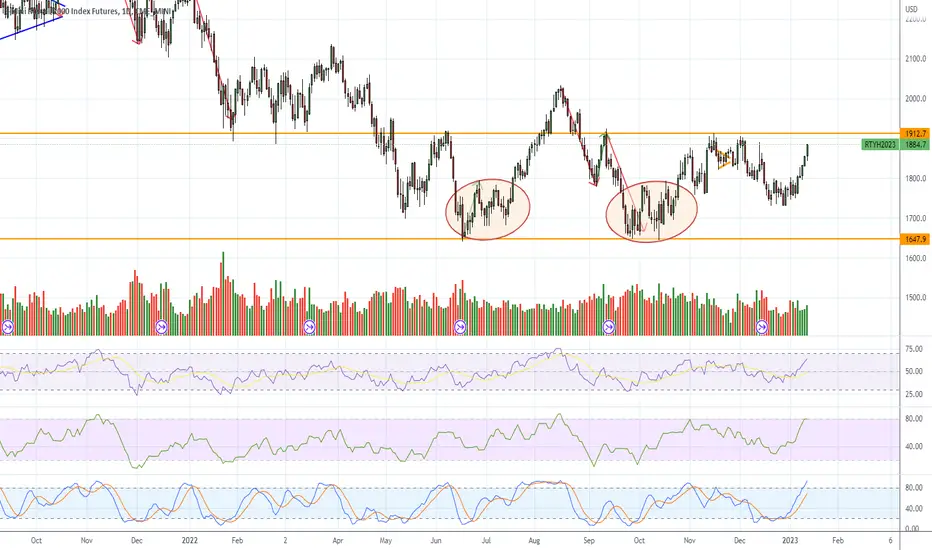
On price action, the 1900 level proves to be of significant resistance, with multiple attempts to break through being rejected. As prices creep towards this resistance level once again, we think this might just provide another attractive opportunity for trading.
Zooming out to a daily timeframe, the 0.382 Fibonacci levels marked by the previous high and low, also coincide close to the resistance levels on the shorter timeframe.
The proven downside volatility, along with the coming turning point in the yield curve inversion, keeps us bearish on the Russell 2000. Additionally, the price action points to significant resistance overhead, around the 1900 level. Setting our stop at 2035 level (one Average True Range away & close to the next resistance level) and take the profit level at 1690, with each 1-point increment in the Russell 2000 futures contract equal to 50$.
The charts above were generated using CME’s Real-Time data available on TradingView. Inspirante Trading Solutions is subscribed to both TradingView Premium and CME Real-time Market Data which allows us to identify trading set-ups in real-time and express our market opinions. If you have futures in your trading portfolio, you can check out on CME Group data plans available that suit your trading needs www.tradingview.com
Disclaimer:
The contents in this Idea are intended for information purpose only and do not constitute investment recommendation or advice. Nor are they used to promote any specific products or services. They serve as an integral part of a case study to demonstrate fundamental concepts in risk management under given market scenarios. A full version of the disclaimer is available in our profile description.


Russel 2000 Head and Shoulders in playAfter another head and shoulder that broke to the downside, we find a similar pattern playing out. As the RSI is pointing down whilst there is a downtrend in play, we are looking for the head and shoulders to be completed and break down.
The next target corresponds with the previous supports of dec. 2018 and aug. 2017.

RTY partial update for the next Jan 16th week I hope everyone is having a great weekend.
RTY is in the bull channel all week, similar to NQ’s rising wedge.
As you can clearly see, RTY is way oversold on the 4h chart (MACD, RSI); this will get a strong rejection of the next resistance zone imo
Looking at the cycle,s we still can push into Tuesday am open to test the major trendline around 1915-18 (depending on landing time). At the same time, it can fall apart straight from the open.
I think we extend on Sunday (gap up?) or into Monday (Futures will be trading open till noon)
- The primary support and target for the next week is 1847-52, from where (if it holds by the 20th) we should see a last push up into the Jan 24th high.
If that support is broken, it should test the 1800 level and below next.
- The target box for the final move-up is at 1542.5-1952.5RTY.
........
SPX and NQ will be updated on the site
Enjoy your weekend

RTY UpdateWaaaay overbought but it does have a cup and handle pattern going on. I think we get a reversal tomorrow and a dip Tuesday.... or maybe a dip tomorrow, I dunno.
CPI was bullish but I don't chase overbought markets. Will decide what to do Tuesday. Bought some PDD puts just so I watch the market tomorrow. Just guessing that Asians were the ones dumping futures in the afternoon.

RTY is setting up for a strong move downIm not currently trading RTY, but it has the weakest structure out of 4 bog indexes.
With the today's rally, RTY rallied the lest compare to the ES and NQ, where ES was leading on the upside, while NQ gave up less when it started to sell
For those who trade RTY, there is a great short setup is setting up

RTY updated chart from yesterday's postThe price is above Monday's high, which suggests one more push going into the CPI numbers
I have mentioned also in my SPX , NQ and ES updates about the possible inverted OCT 13th CPi release move tomorrow.
A Gap and Crap full report was posted last night and updated today


RTY Short IdeaThe RTY one hour time frame is in a channel. The
market is near the top of the channel. As long as
the market stays below the top of the channel. It
is expected the market to push bearish towards
the bottom of the channel.
Entry: counter trend line break bearish
below the top of the channel.
STOP: In the buy zone above the entry.
LIMIT: 1756.7
Once or if the one hour time frame gives the
entry. As long as the market stays below the
top of the channel. It will be a good idea to
turn to the five minute time frame and look for
tunnel trader short, chandelier trader short,
and or destination trader short ideas towards
the one hour price target.


Equity market outlook - January 2023Purpose
This analysis is meant to provide a long-term outlook for equity markets.
I also use this to support my data-driven, long-term investment decisions. Sharing this with the public helps me avoid one of the most common mistakes investors make in the market - missing the forest for the trees.
Table of contents
Central banks policy
Economic growth outlook
Earnings growth outlook
Liquidity in the financial system
Summary
Central banks policy
Central banks around the world are still tightening monetary policy which is a headwind for economic growth - see the section below.
Tight monetary policy means there will be potentially more pressure on 10Y real yields - if inflation will be persistent.
There has been a strong correlation between 10Y RE and S&P 500 Forward P/E since 2018. Tight monetary policy + persistent inflation = lower Forward P/E = higher pressure on S&P 500.
What has already been embedded into the price? Eurodollar futures term structure can help answer this question. The market expects rate cuts in September 2023. This would support a higher P/E, but it would also mean that something has been broken on the market. The shape of the curve suggests that the market expects rather hard landing than soft landing.
No one knows for sure what FED will do in the future, but if they follow the path outlined by the eurodollar futures market then we are near the bottom of forward P/E. In that context, the cheapest stocks are in the S&P 600 index = small cap index. Forward P/E is 12.5. Their lowest value was during the GFC - just below 10. The most expensive is S&P 500, with a forward P/E of 16.7.
Economic growth
Central banks' policy leads economic growth / contraction that can be measured by CLI Diffusion Index:
The index suggests we should not expect positive stock indices YoY growth yet. What's more important, it says a high volatility period might be around the corner.
However, the National Financial Condition Index has already been elevated, so lots of depression fears have already been discounted.
Earnings growth outlook
I use the Nominal Broad U.S. Dollar Index, BBB US Corporate Yield, WTI price, and ISM New Orders less ISM Customer Inventories to measure the impact of current conditions on future corporate earnings.
As a result, I get an indicator that tends to lead stock indices YoY changes, especially Russell 2000 - because it is the index that is the most sensitive to real economy changes.
We should not expect earnings to grow in that kind of environment.
Liquidity in the financial system
I use three indicators to measure liquidity. I normalized the readings to z-scores - just to look at them from the same perspective.
1. FED Balance sheet less Reverse Repo (Overnight Reverse Repurchase Agreements) less TGA (U.S. Treasury General Account): there is still plenty of money flowing in the financial markets despite ongoing QT
2. Top of the ES futures order book (the number of contracts in buy orders and sell orders): despite the end of the year period, the liquidity (on average) is just fine. No need to worry about air pockets right now.
3. Finra margin debt - the deleveraging is ongoing. $292B has been removed from investors' margin accounts so far, but there is still plenty of money borrowed from brokers - we're at levels last seen in 2018.
Summary
Forward P/E trough might be just around the corner, but central banks policy still does not support growth. It can be seen on the CLI Diffusion Index.
On the other hand, tight financial conditions should soon impact corporate earnings.
In that kind of environment - where EPS should not be rising and P/E not falling - selling the rip and buying the dip strategy might benefit more than just buy&hold.
I'll wait with my long-term investments.

$RTY Cypher level 👀👀👀👀👀 1747$ Watching $RTY on this Cypher @786 trigger;
Entry on candle confirmation only, Pin bar, engulfing bar, inside bar.
Tp 1 382 Take 1/2, stop to break even (entry)
Tp 2 618 take half of balance
Tp 3 Top of pattern, not likely to trade but will leave runner if we get to tp 2
stop below X.
Please let me know your $RTY ideas :)
Thanks for taking a look, Happy New Years to all 💸💸💸💸💸💸💸


