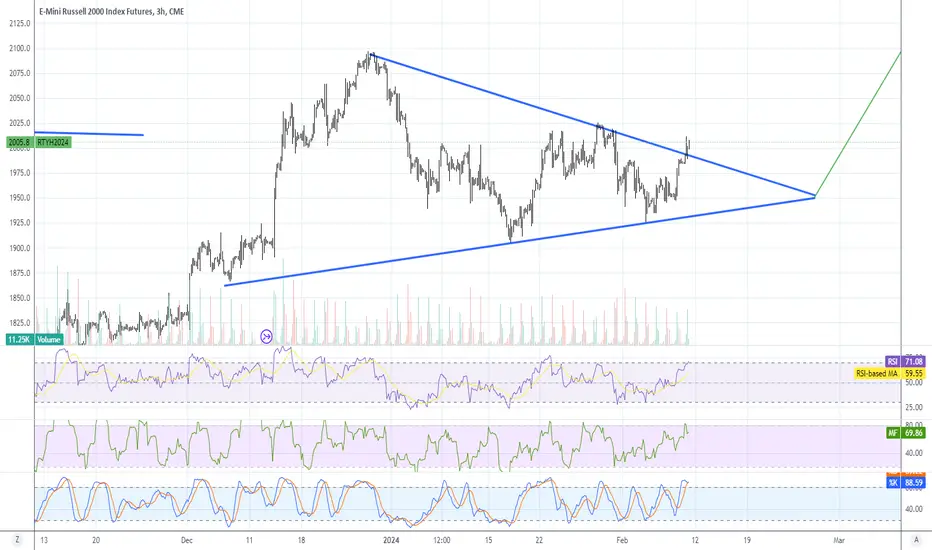
RTY UpdateChart pattern looks like a breakout but indicators went overbought on my 3 hr.
I closed out my small position in garbage stocks. (I was right when I posted that yeserday, lol) Return was good in terms of percentage, but I didn't have much. Who wants to risk a lot in garbage stocks?
Not really sure what happens next week, might just sit and watch until CPI numbers come out Tuesday
RTY1! trade ideas
I did a quick look at about 10 markets looking for a reversals2.13.24 This video is about what it really is like making a trade decision when it's hard to make the decision. My point is that you have to practice deciding when to take a trade and when there's enough evidence to take the trade with a higher probability that the market will take you in the direction you are trading. You should train yourself to do this.... if you can't remember what you said previously... then take notes and go back to your notes a day later... and figure out why you were wrong.... when you were wrong. Keep a record of your trades... but more importantly you will learn that you will read some markets better than others and you want to learn what that is when you paper trade. You don't have to take the trades that have conflict that you will be able to recognize. Stay away from those trades...When you are sure that the situation is not clear. Impulse trading with unclear setups is a very expensive mistake. think of an unclear trade as an opportunity to relax and sit back and wait and that you're not in any jeopardy because you've decided to not trade where the market's unclear... think of it as a gift.


The Russell11.16.23 I thought I would take a look at the Russell futures because I think there is a reasonable probability trade to short the market with a small stop.... and yet this was a bullish market yesterday. I would have placed the stop very close to my trade entry. I believe the short trade is a higher probability trade but it is a lower reward trade Unless I want to sit around and wait for the market to get to the first target. If the market gets to the first target and starts to reverse and finds buyers...Then I would be Wondering if the market is going to set up to make new highs. There's more to it.... which means you have to follow the price action.

Russel 2000 WeakLet's take a look at the Russel 2000. This index seems to be the only one between the Dow, Nasdaq, and S&P that is failing to break to new ATH while they are.
What we're seeing is a triple top/triple resistance in Aug 2022, than again February 2023, and again August 2023 which was confirmed with a break down to the lows of October 2023 before more manipulation came into play. Some will say inflation is declining and talks of rate cuts seems to be the reason markets rose, but from what we are hearing today from the Fed is that rate cuts aren't likely as they continue to backtrack and downplay rate cuts.
Perhaps, they know something before we do... perhaps double peak inflation like the 1970s? Just as everyone believes its declining, surprising new data comes out that proves otherwise? Let's see.
Once again we see the Russel 2K failed more recently to break and hold above 2020 with constant rejections. This would be the 4th rejection and we could be on the 5th rejection. And why not? Banks once again are starting to shake, with JPMorgan losing deposits, NY Community Bank failing, banks invested in CRE are tanking and this before the big ending to their Bank Term Funding Programme (BTFP) officially ending. Look at the chart for it, it spiked in March 2023 with the failure of SVB, and it is spiking once again Jan and Feb of 2024. Something coming down the pipelines?
I shudder when I see markets breaking ATH, because it has ALWAYS meant markets are more vulnerable to bad news (be it financial, economical, or geopolitical). What we're witnessing is a market that is getting fundamentally weaker and weaker. The economy does not support equities hitting ATH, as earnings are revised lower, personal debt is $17 TRILLION dollars (an ATH) and personal savings are at an all time low. This is not including the decaying jobs market, retail, national debt, manufacturing, consumer sentiment and so on. The floor is a 1 centimeter sheet of ice and it's warming up. This bubble is poised to pop any moment now.
My advice
Obviously, be vigilant. If you are holding positions from a lower price point and you are making profit, I say hold until whatever event happens and breaks the glass floor. If you are new money looking to invest, I can not suggest investing now at the top with such toxic economy and financials. Do your own research, look at the economic data and see if any of it or at least majority of it gives you peace about investing. People are broke, debt is exploding so retail will inevitably collapse and since we're a retail based economy, you can imagine what comes next.
Targets for Russel 2K - IWM
1) 1915, if we break that then
2) 1730, if we break that then
3) 1680, if we break that then
4) 1630, if we break that then run for the hills.


Divergence in Small Caps Warns of Selloff in SPXSeen this before. SPX climbs relentlessly, driven by the Magnificent Seven. Russell small caps, America's real stock market, do not participate above a resistance price, ~2K index price. Twice rejected there, first rally went to ~2400, this time it's a lot less.
IMO this monster rally back to SPX ATH is just another bear market zig-zag, and the worst may be yet to come.
Watch the small caps closely. They always tank first. Get ready for Zag.
You gotta be crazy to invest in stonks up here... GLTA.

Russell 2000 (RTY) Rally Should Fail for More DownsideShort term Elliott Wave View in Russell 2000 (RTY) suggests the decline from 12.28.2023 high is unfolding as a double three Elliott Wave structure. Down from 12.28.2023 high, wave W ended at 1938.6 and wave X ended at 2004.87. Wave Y lower is in progress as another double three in lesser degree. Down from wave X, wave a ended at 1966.4 and wave b ended at 2003.10. Wave c lower ended at 1944.70 which completed wave (w). From there, wave (x) rally ended at t 2003.30 as a zigzag. Up from wave (w), wave a ended at 1977.10 and wave b ended at 1957.30. Wave c ended at 2003.30 which completed wave (x) in higher degree.
Index resumes lower in wave (y) with internal subdivision as a zigzag. Down from wave (x), wave a ended at 1958 and wave b rally ended at 1971.10. Wave c lower ended at 1904.80 which completed wave (y) of ((w)). Expect Index to rally in wave ((x)) to correct cycle from 1.9.2024 high before it resumes lower. Rally is unfolding as a zigzag where wave (a) ended at 1929.4 and wave (b) ended at 1910.10. Expect wave (c) higher to end at 1934.2 – 1949.9 area which should complete wave ((x)) in higher degree. Near term, as far as pivot at 2004.87 high stays intact, expect rally to fail in 3, 7, 11 swing for further downside.

Micro Russell Plan of AttackLet's go over the plan for a possible trend reversal on the Micro Russell using our TrendCloud Trading strategy.
Right now we are in a strong downtrend on the one hour chart with downward momentum.
The 15 min trend has been terminated and the TrendCloud is telling us that we already have trend reversal because of the moving average crossover.
However we have not crossed above +100 yet. So we still need that piece of the equation before taking a long entry.

S&P 500 & Russell 2000 Support And Resistance Entry LessonI Recorded this video originally for myself for a recap for my Journal but thought it had some good information on support and resistance and using different lenses to view the market. I go over my two losses I took on both the S&P 500 and Russell 2000 but I think they did help prove to me that your entry is extremely important and working on getting better entry signals using alternative charting or doing other various things can really influence the odds of either getting stopped out or not getting stopped out hope this can help. :)
CME_MINI:ES1! CME_MINI:RTY1! CME_MINI:MES1! CME_MINI:M2K1!

Micro Russell Late Night TradeThis is the first trade that I am taking for the TrendCloud Trading Challenge.
Going for 2:1 Target
4 hour and 1 hour chart are both in a downtrend as well as the 15 min chart
1 hour CCI is below -100
Took the TrendCloud Signal on the 15 min candle.
1 hour trend is just starting to become extended so keeping a tight stop on this.

Micro Russell Trade: Prop Trading ChallengeDowntrend on the Daily, 1 hour and 15 minute charts.
TrendCloud Scanner pulls up the Micro Russell
TrendCloud Signal on the 15 min chart
Take the trade short 2:1 target hit
Scale out of the trade and let this winner run.
We are shooting for 8% in the next 2 weeks of trading for this Prop Trading Firm Challenge.
Sign up with TrendCloud and practice with us for FREE.


Market Weekly Forecast: S&P, Nasdaq & Russell 2000In this video, I provide my market analysis for the upcoming week (1/16-1/19) focusing on S&P 500, Nasdaq 100, and Russell 2000 Futures. Understanding the market environment is crucial for both day traders and swing traders. I discuss how to ascertain if this week will be a consolidation week or if there's potential for range expansion. If it's a consolidation week, we can trade the market in both directions throughout the day. If it's range expansion, we should favor that direction and not fade it. For market direction, I utilize tools such as Bollinger Bands, AVWAP, a 5-day sma, and my Beacon Indicator.

The Russel is on it's Way to New HighsRecently, the Russell 2000 achieved a breakout from a sideways trading range that has been in place since March 2022.
Considering the macroeconomic environment and chart analysis, we believe that, despite today's retracement, there is no doubt that the index is on a direct path towards a new all-time high.
The two marked trade ideas provide opportunities for both conservative and aggressive profit-taking strategies.

Russel 2000 Rectangle Pattern Bullish BreakoutThe Russel 2000 has broken through a long standing Darvas Box resistance level (yellow horizontal line) on the Weekly chart.
This has formed a rectangle base in the Russel 2000 with a 23% gain price target , calculated with a 1 to 1 upward move from the top of the Darvas Box resistance level to new highs on the Russel 2000. This is not investment advice.

E-mini Russell 2000 Futures: Back to Bargain-BuyingOur View
Markets have rallied to record highs thanks to growing optimism that the US will be able to tame inflation without triggering a recession; and that the Fed will cut interest rates in 1H 2024. In a soft landing, we expect investors to start looking for bargain-buying opportunities in overlooked corners of the market including small caps.
From a valuation perspective, valuations in the small cap corner of the market are more attractive. The S&P 500 is trading at a Last 12 Mths P/E ratio of 22.7x; compared to a P/E ratio of just 18.8x for the S&P 500 Equal Weighted Index, which gives greater weight to companies with smaller market cap.
Since the end of October, the small cap focused Russell 2000 has outperformed the broader S&P 500 and the Magnificent 7, rallying by +19.42% as of 15 December. This is well above the S&P 500's 12.53% and the Magnificent 7's 14.35%.
Expressing Our View
We favour the hypothetical trade setup below in order to express our view.
Long E-Mini Russell 2000 Futures:
With a Fibonacci Retracement drawn from the November 2021 high, we favour taking a long position with entry around the present level of 2010, target level of 2280 around the 0.786 retracement level, and stop loss below the 0.382 retracement level around 1935, This setup delivers a reward: risk ratio of 3.66x.
At the same time, the 50EMA seems to be heading towards a bullish crossover with the 200EMA- a "Golden Cross" that typically signals strong bullish momentum.
• Entry Level: Present level of 2010
• Target Level: 2280
• Stop Loss Level: 1935
• Profit at Target: 2710 ticks x $5
• Loss at Stop: 740 ticks x $5
• Reward: Risk Ratio: 3.66x

Weekly chart - Testing resistanceIWM had a strong week.
It is still in what I consider a Resistance Zone.
So I'm currently looking for bearish positions and signs of weakness.
Notice that IWM has generated strong moves before that turned out to be false moves.
It will be interesting to see at which price levels we'll close the year.

December E-Mini Russell 2000 Index Futures Weekly Chart: 12/7/23Last week we saw the December E-mini Russell 2000 Index futures continues its bullish run with its third consecutive green candle closing into the Ichimoku cloud and above its 52-week moving average. With this move up, the MACD showed a bullish cross indication by crossing its signal line. RSI is trending up along with price. A continuation of this uptrend might find resistance at the top of the Ichimoku cloud (~1,906) and at the 200-week moving average (~1,930). A reversal to the downside might find support at the recent lows at the end of October (~1,640).
Please Note:
Commentary and charts reflect data at the original time of analysis (12/01/23). Market conditions are subject to change and may not reflect all market activity.

$RTY1 $IWM Big downtrend break - potential breakout underwayCAPITALCOM:RTY AMEX:IWM looks primed for a breakout. it's been lagging the other indices and with rates going lower, a lot of growth names could see some headwinds here. Market likes to get ahead of itself. From a technical perspective, it broke the downtrend from prior ATH before but failed and now it's trying again. Could be a good move out of it


Russell 2000 (RTY, M2K) Low-Timeframe ShortQuick idea here as we look to get back in a groove with analysis/posts after a very light October. Not going to include a lot of elaboration, but we're looking to take advantage of a swing short (price depending) via a low timeframe (5-minute) RTY supply zone (defining candles not pictured here since sub-15-minute charts cannot be posted). If price approaches the zone hot (expanded range candle vs. grinding action), look to take the trade outright upon penetration of the lower bound (1795.4). If RTY stair-steps higher, forming new pockets of demand between current price and supply, consider taking a confirmation entry (price exit from zone). Stop should be placed a bit above the zone's upper bound. Keep in mind round # psych @ 1800. Targets are 2:1 and 5:1 (look for a fall back to origin of CPI breakout). Finally, US stocks have been very bullish as of late, so shorts fly in the face of current momentum. That said, RTY has consistently been the weakest of the 4 US equity indexes, so if you're going to short one, it's probably your best bet. Have to run, but good luck!
Stay tuned b/c a LOT more ideas are coming soon!
Jon @ LionHart Trading

Russell 2000 Futures (RTY) Turning Lower After 3 Waves RallyRussell 2000 Futures (RTY) rally from 10.28.2023 low has ended in 3 waves at the 100% – 161.8% Fibonacci extension. This suggests that the rally is corrective in nature. Up from 10.28.2023 low, wave A ended at 1779.6. Pullback in wave B ended at 1687.40 with internal subdivision as a zigzag Elliott Wave structure. Down from wave A, wave ((a)) ended at 1727.10 and rally in wave ((b)) ended at 1746.8. Wave ((c)) lower ended at 1687.40 and this completed wave B in higher degree.
The Index then turned higher in wave C. Up from wave B, wave ((i)) ended at 1717.10, and dips in wave ((ii)) ended at 1694.5. Index extended higher in wave ((iii)) towards 1824.80 and pullback in wave ((iv)) ended at 1801.60. Final leg wave ((v)) ended at 1838.50 which completed wave C of (2) in higher degree. The Index has turned lower in wave (3). Down from wave (2), wave (i) ended at 1799.40 and rally in wave (ii) ended at 1813.50. Index extended lower in wave (iii) towards 1770.50. Expect wave (iv) rally to be followed with wave (v) lower to end wave ((i)). Afterwards, it should rally in wave ((ii)) to correct cycle from 11.16.2023 high in 3, 7, or 11 swing before it resumes lower again.
