GC Buy Stoptook a nice set up during london as Im trying to get used to trading London as I did back in 2017-2020
Red Folder News at 10 est. Keep that in mind Only targeting 1:1 on this... always 40 ticks risk
GCJ2021 trade ideas

GC 1H Buy Idea 6/12/24Looking for price to return to the previous 1H high around 2335 for a retest and possible bullish continuation. This area is also around the 61.8-71.8 FIB levels.
**This is for educational purposes only and this is not financial advice because I am not a financial advisor.**

2024-06-13 - a daily price action after hour update - goldGood Evening and I hope you are well.
gold
comment: This does look a lot more like a trading range than a market who want’s to have it’s third leg down. 2300 continues to be big support and until that is clearly broken, it’s a buy at that price. For the pull-back to stay below 2360 is bearish. So market has arguments on both sides and that is why we can expect more sideways price action until that range is clearly broken.
current market cycle: trading range
key levels: 2300 - 2360
bull case: The longer they can keep it above 2300, the more neutral the market becomes and the odds for a breakout to either side become 50/50. Market is in balance here, so no good arguments for higher or lower prices. The current bear channel is reasonable and maybe the bulls are favored down here to trade it back to around 2330 tomorrow.
Invalidation is below 2300.
bear case: Need a break below 2300. No better arguments for their case either.
Invalidation is above 2360.
short term: Completely neutral inside given range.
medium-long term: For now I think the most reasonable outlook I could give is a trading range 2200-2450. This could hold for some time. Bear in my still thinks this rally is dumb and we will see 2000 again this year but that’s as unreasonable of an outlook one could hold so DON’T.
current swing trade: None
trade of the day: Yeah just a weird day. Expanding triangle first and then another big sell against the 1h 20ema.

gold silver interday update edu. purgold styaa bv 71450 looks up side till 71600-700 where support 71350 silver styaa bv 87500 looks up side 88000 support 87200 expect buy on dips with support sl

gold silevr update edu pur.gold spot stya blw 2310 looks dwn fall till 2303--2290 in mcx 71300 tya blw dwn only 70900 expect where hurdel 2320 in mcx 71516@-- silver stya blw 28.90 looks dwn ward 28.60--28.30 in mcx 87000 blw looks dwn fall till 86400-86001 87500 crucial hurdel for up side let see wht happen


Gold Macro Analysis - $2400 by JulyGold has been trading in and above the previous ATH zone since April of this year.
Large amounts of seller volume was enough to bring us down to $2300 June 7th; however the zone held.
We've failed to make either a higher high or a lower low during the last week and we're currently in a tighter consolidation on the daily chart.
There's liquidity on both sides, but it's more likely we see a break in the short term downtrend than prices below $2300.
$2375 shouldn't offer much resistance, with $2400 being the next psychological price and previous resistance level.

Gold/Silver Neutralizing FridayGold (August) / Silver (September)
Gold, yesterday’s close: Settled at 2344.4, up 13.2
Silver, yesterday’s close: Settled at 29.525, down 0.089
Gold and Silver futures are again on their backfoot. Despite a firm tape overnight, comments from Fed Governor Bowman that it is not time to cut rates, even pointing to the possibility of hikes in the case of persistent inflation quickly eroded the positivity. It is important to understand that Bowman is the most hawkish voice at the Fed and no stranger to outlier comments. We now look to CB Consumer Confidence data at 9:00 am CT.
Today marks the expiration of July options for both Gold and Silver, and this could bring a wonky tape through midday. For now, strong resistance has developed into the latter part of Friday’s bludgeoning, bringing major three-star resistance at 2348.7 in Gold and 30.07-30.12 in Silver; we must see move out above here in each in order to even start the path to neutralizing Friday’s tape.
Bias: Neutral/Bullish
Resistance: 2348.7***, 2355.3-2358.8***
Pivot: 2341
Support: 2329.5-2331.2**, 2318-2320.2***, 2304.2-2310.9***
Silver (Sept)
Resistance: 30.07-30.12**, 30.19-30.27**, 30.40-30.57***, 31.04-31.15***
Pivot: 29.90
Support: 29.69-29.79**, 29.30-29.38***, 29.03-29.05****
Check out CME Group real-time data plans available on TradingView here: www.tradingview.com
Disclaimers:
CME Real-time Market Data help identify trading set-ups and express my market views. If you have futures in your trading portfolio, you can check out on CME Group data plans available that suit your trading needs www.tradingview.com
*Trade ideas cited above are for illustration only, as an integral part of a case study to demonstrate the fundamental concepts in risk management under the market scenarios being discussed. They shall not be construed as investment recommendations or advice. Nor are they used to promote any specific products, or services.
Futures trading involves substantial risk of loss and may not be suitable for all investors. Trading advice is based on information taken from trade and statistical services and other sources Blue Line Futures, LLC believes are reliable. We do not guarantee that such information is accurate or complete and it should not be relied upon as such. Trading advice reflects our good faith judgment at a specific time and is subject to change without notice. There is no guarantee that the advice we give will result in profitable trades. All trading decisions will be made by the account holder. Past performance is not necessarily indicative of future results.


Gold bubble seems to burst in the coming days!Get intraday and holding investment recommendations for both gold and silver. Include both Indian and international market rates.
in.investing.com

Looking for shorts in Gold.If the market breaks this support,all my conditions for a short trade would be set and it would be a RR 1:1

Short GC @ 2249 on AbsorptionGC is in a converging triangle here and I think after the large selloff from Friday has more room to the downside before finding a bottom. There is a lot of resting liquidity at 2349 plus the psychological level of 2350.
I am thinking that GC rallies up to this area before being shorted back down again and finding a new bottom. Stop loss at 2353 and take profit at 2341 for a 2:1 RR.

GOLD COMEX - Intraday Levels - 24th June 2024if Sustain above 2340.8 then 2349.1 to 2352.2 above this bullish then 2358.3 to 2360.5 then 2369 to 2370.3 tabove this more bullish
if Sustain Below 2331.3 then 2325.8 below this bearish then 2312.3 or 2311.0 Strong level then 2303.7 to 2299.8 below this more bearish then 2295.4 to then 2287.5 to 2285.3 then 2283.1 then 2279.3 then 2275.5 to 2272.9
Consider some buffer points in above levels.
Please do your due diligence before trading or investment.
**Disclaimer -
I am not a SEBI registered analyst or advisor. I does not represent or endorse the accuracy or reliability of any information, conversation, or content. Stock trading is inherently risky and the users agree to assume complete and full responsibility for the outcomes of all trading decisions that they make, including but not limited to loss of capital. None of these communications should be construed as an offer to buy or sell securities, nor advice to do so. The users understands and acknowledges that there is a very high risk involved in trading securities. By using this information, the user agrees that use of this information is entirely at their own risk.
Thank you.

6/23 | $GCPretty clean consolidation pattern here every since making a new ATH. Looking for price to retrace into my 3H demand zone (Green box) to buy around $2300.

#202426 - priceactiontds - weekly update - goldGood Evening and I hope you are well.
gold futures
Quote from last week:
comment: Market stayed above 2300 and it’s time to reevaluate my take on this. The bear trend could very well be a two-legged move inside a trading range 2300-2477. So going forward I have clear invalidation points for both drawn outcomes. If bears keep it below the daily 20ema which is 20 points above Friday’s close, this bear trend can continue and my target would be 2270ish. If bulls get above last week’s high 2358, this is much more likely a trading range and 2300 stays support for now. Bears are clearly getting weaker. I wait for market to show strong momentum in either direction but still favoring the bears to reverse here.
comment: Bears let it get back to 2382 before they violently sold on Friday for 53 points down. I was so annoyed by the move up to 2380, that I somehow ignored the fucking alert which broke below 2368 and I did miss the whole move. Very bad trading on my end. The last month looks pretty fractalicious to me. Yes that word exists. Now. Move on. Bears need strong follow through to test 2300 again. Right now the small bull trend line is support until clearly broken. If bears fail 2300/2330 again, they will probably give up and retest the highs again, which would confirm the current triangle.
current market cycle: trading range until 2300 is broken.
key levels: 2300 - 2400 / below 2300 comes 2270 in play
bull case: Bulls see the green support line and want to keep it support and keep the market above 2300/2320. They stalled the market long enough that not enough bears want to push their luck, selling the lows here. They also managed to print 2 bars above the daily ema, which makes the market more neutral.
Invalidation is below 2300.
bear case: Bears see another lower high and a strong sell signal on Friday. They want to break below the support at 2300/2320 and finally break it with some force for a W5 down to my first measured move target and around the breakout price 2270. If bears can not break below 2320 on Monday, we will probably see more sideways movement.
Invalidation is above 2380.
outlook last week: “Bearish. Big bear surprise on Friday and I expect follow through. ”
→ Last Sunday we traded 2349 and now we are at 2331. Was neutral and market made -18 points on the week. Decent outlook but prices were a bit off.
short term: Play the triangle if the support holds.
medium-long term: For now I think the most reasonable outlook I could give is a trading range 2200-2500. This could hold for some time. Bear in my still thinks this rally is moronic and we will see 2000 again this year but that’s as unreasonable of an outlook one could hold so don’t. —unchanged
current swing trade: None and won’t enter. Just scalps for me.
Chart update: Added small support line for bears to break.

Something slight check out some of my ideas. also I don't take every trade idea that you see here
these are assumptions before price action completes and confirms. The point of my ideas is try to predict price action everyone knows that's next to impossible but I'm having fun.
I am not a professional trader nor am I technical . all ideas are based on what I understand price to be. when I see certain confluences that fits my trading strategy I then look for my opportunity to enter trades.
to many egos here. we are all independent traders navigating the market. happy trading

Daily Market Watch: GOLD is BEARISH!The bearish bias going into this week was correct.
The market printed a bearish candle for the day, on the way to completing an IRL to ERL
movement.
I'm holding the same bias for tomorrow, as we near the first SSL target at the most recent swing low.
BOOST and subscribe if you like the analysis.
Thank you.
May profits be upon you.

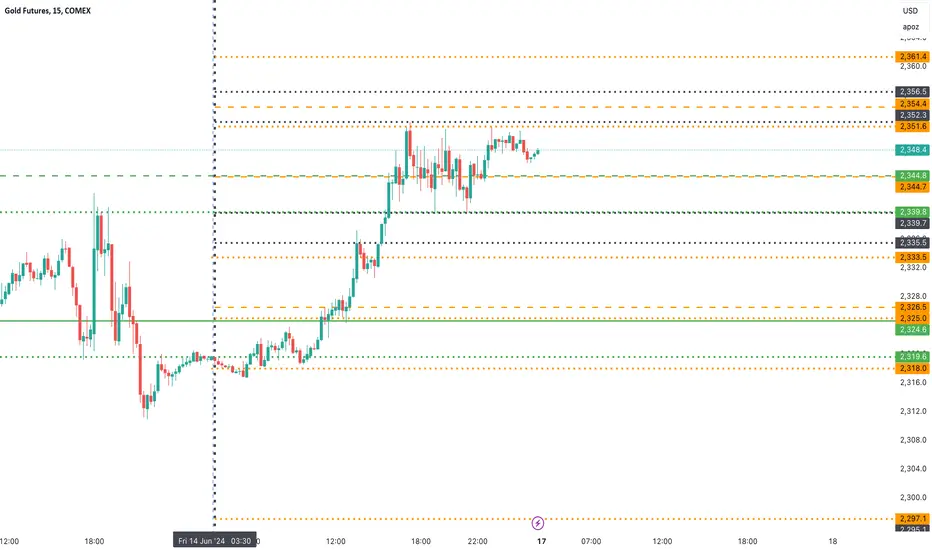
Gold COMEX Future - Intraday Levels - 17th June 2024if Sustain above 2351.6 or 2352.3 then 2354.4 then 2356.5 or 2361.4 above this bullish then 2372.6 then 2379.6 then 2396.9 to then 2412 to 2413.7 or 2417.1 to 2417.9 above this more bullish
if Sustain Below 2344.7 then 2339.7 to 2335.5 or 2333.5 below this bearish then 2326.5 to 2324.6 then 2319.6 to 2318 below this more bearish then 2297.1 to 2295.1 then 2290.9 to 2290.1
Consider some buffer points in above levels.
Please do your due diligence before trading or investment.
**Disclaimer -
I am not a registered analyst or advisor. I does not represent or endorse the accuracy or reliability of any information, conversation, or content. Stock trading is inherently risky and the users agree to assume complete and full responsibility for the outcomes of all trading decisions that they make, including but not limited to loss of capital. None of these communications should be construed as an offer to buy or sell securities, nor advice to do so. The users understands and acknowledges that there is a very high risk involved in trading securities. By using this information, the user agrees that use of this information is entirely at their own risk.
Thank you.
Gold 70,100 possible !!we have seen on daily time frame price formed rising wedge pattern
on friday 7jun we seen a bearish big candle confirming the breakdown of the pattern
price then tried to take a bounce from recent orderblock
but we can clear see that the bearish pressure is not letting the bullish orderblock go any further up
causing the price to form a small triangle pattern which will eventually work as buildup for more down side and we can 70,100 level in coming days
will further after price hits 70,100 level
follow for more

GC\Gold 1H Buy Idea 6/17/24Looking for GC/Gold to continue higher from here to at least the previous 1H Highs
**This is for educational purposes only and this is not financial advice because I am not a financial advisor.**

goldsold at this time start down trend and it can touch 2300
if 2300 dollar is lost, it can continue down trend to 2220-2200 dollar

Gold AnalysisThis is not a trade advice but rather our own view on the Gold. So , what we are sharing here is not an invesment advice. In this post, we analyse the Gold and it potential future bullish move.

Gold reacting to resistance line $2400 before Distribution phaseThe chart suggests a strong uptrend in gold prices with potential resistance around 2454.2 USD. Monitoring how the price behaves at this resistance will be crucial for future predictions. A break above could signal further bullish movement, while a reversal could indicate a pullback to lower support levels.
Bullish Scenario: If the price breaks above the high resistance level of 2454.2 USD, it could indicate a continuation of the uptrend, potentially reaching higher levels within or above the channel.
Bearish Scenario: If the price fails to break above the resistance and reverses, it may pull back to the nearest support level around 2174.6 USD or even lower to 2073.9 - 2011.7 USD.
