FUTURES GOLD i LIKE THIS POTENTIAL SETUP. WE are at an area of supply. Price is consolidating. I would like to see price break below that support giving us the notion that price will only correct and sell back to those previous areas of support and I have marked out the tp targets as those areas we might see some strong rejection as price is still very bullish
Micro Gold Futures (Aug 2024)
2,501.0USD / APZD
−15.0−0.60%
At close at Aug 28, 2024, 13:40 GMT
USD / APZ
No trades
MGCQ2024 trade ideas

$MGC(Gold) EW Recount. Two Possible scenarios!!! - June 11, 2025Hello fellow gamblers,
As you can see in the title, I had to do a recount of my EW analysis for gold since we did fail to break below support towards our Wave C target.
This video is a bit long because i bring 2 different scenarios that could be playing out at this time.
I hope you enjoy!
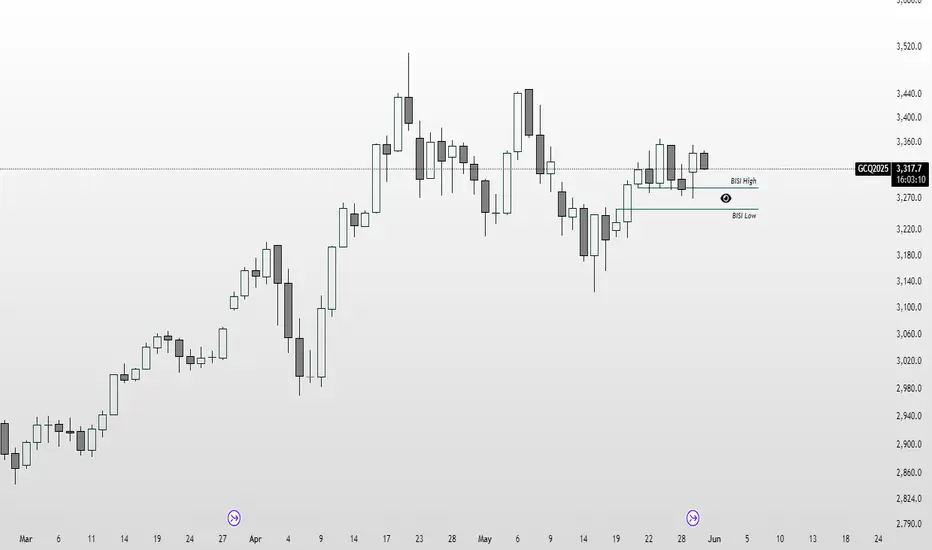
- Watching for price action behavior near the down trendline and watching for the FVG gap to hold support.
- Levels to watch: 3418.2, 3398, 3360.4, 3324


Gold Futures – Double Top Leads to Bearish SetupGold Futures on the MCX chart is showing a classic Elliott Wave pattern in play. After forming a regular flat correction with a double top near the 99,300–99,200 zone, prices have started to drift lower. The double top structure—combined with the completion of Wave B—suggests that a Wave C decline is underway.
Wave A took the price down to around 90,890, followed by a corrective Wave B that failed to break the previous high convincingly.
The near-term outlook on the 4-hour timeframe remains bearish. I am anticipating five waves down within Wave C, which may take price back toward the previous Wave A low or slightly lower, possibly ending in a diagonal pattern, before a bullish reversal can be expected.
Disclaimer: This analysis is for educational purposes only and does not constitute investment advice. Please do your own research (DYOR) before making any trading decisions.

Gold May Continue to Frustrate TradersGold prices have stalled once again and have struggled to make any significant advances since mid-April, remaining stuck in a range between $3,150 and $3,450. This trading range has resulted in sideways price action, with several false starts along the way. However, technical analysis suggests that this range is likely to remain in place.
After breaking above a downtrend in late May — a move that initially appeared convincing, with prices surging to $3,400 — gold has since declined, falling back to $3,300. As of 10 June, it is now retesting that trendline and bouncing at $3,300. This price also represents the 38.2% retracement of the rally from the 15 May intraday low of $3,120 to the 5 June intraday high of $3,400. The combination of the trendline and the Fibonacci retracement level is currently acting as support.
Additionally, the Relative Strength Index (RSI) has broken above a downtrend, indicating a potential shift in momentum. At the time, all of this suggested that gold was likely to retest its previous highs.
However, a new problem has emerged — one that is not particularly favourable for further gains in gold. As of 6 June, the price has fallen below a short-term uptrend and has also stalled at resistance around $3,320.
In addition, the Relative Strength Index has now broken below its own short-term uptrend and is nearing the 50 level — a potentially bearish signal. If these developments are signs that all is not well, then gold could be expected to revisit its early May lows, around $3,100.
As things stand, there are two viable paths for gold, and it is far from easy to determine which one is the correct one. Unfortunately, both scenarios suggest that gold is likely to remain range-bound for some time yet.
Written by Michael J. Kramer, founder of Mott Capital Management.
Disclaimer: CMC Markets is an execution-only service provider. The material (whether or not it states any opinions) is for general information purposes only and does not take into account your personal circumstances or objectives. Nothing in this material is (or should be considered to be) financial, investment or other advice on which reliance should be placed.
No opinion given in the material constitutes a recommendation by CMC Markets or the author that any particular investment, security, transaction, or investment strategy is suitable for any specific person. The material has not been prepared in accordance with legal requirements designed to promote the independence of investment research. Although we are not specifically prevented from dealing before providing this material, we do not seek to take advantage of the material prior to its dissemination.

Gold looks like it might be heading Higher6 12 25 this is a long video hopefully it does not fail to upload. I mentioned a number of markets in this includes some advice to one of my students ( there is only one student right now) and that's perfectly fine for me.... but I wanted her to see a couple of markets that she might not be looking at but her worth looking at if she wants to trade more markets. I did not include agricultural stuff which could be a good choice, but I just don't spend time with it.

Scalp it or Swing it, but its bearish There is 65% chance that this trade would hit. Only time will tell though.
The upper trendline is bearish and it held for long, will whales manipulate the price and get the liquidity above then continue lower or the price will just hit lower? only time will tell.
I think maybe we will be visiting the 3000 again, hopefully soon.


GC - Gold digging for a possible ShortAfter reaching WL2, we saw a sharp pullback followed by an immediate double top. Price failed to reach the centerline of the yellow fork, instead stalling at the 1/4 line.
Then came the break of the lower median line (L-MLH), a pullback to the white WL1—then the drop began.
If this market can’t push to new highs, we’ll likely fall back into the median line set. A pullback to the upper median line (U-MLH), as indicated by the red arrows, is a probable scenario.
Next stop: the white centerline.
I trade tiny. I trade with extremely high risk-reward setups. I’m fine getting stopped out all the time —because I’m hunting huge moves.
I don’t chase. No FOMO.
It’s how I sleep well, make money from trading and keep my stress level very low.

$MGC (Gold) Pos-Market Update - June 11, 2025Huge moves happening on gold, price is now in a level in which it could invalidate our ABC scenario. At this moment, I'm not changing my bias. I would like to see a break above that 3397.5 level before that happens.
- Key levels: 3397.5, 3387.6, 3372.8, 3366.7, 3339.7

GOLD REVERESED! Looking for the breakout!We got some news Tuesday that shifted the direction of the pullback and now looking like we might just break out. if we can make it above yesterdays highs and closed on the H4 then I think it will be safe to look for higher levels. but if it breaks down from here then we could still see it reach for Liquidity. We just have to be patient in waiting for price to show its hand.


Gold Pullback Entry Opportunity Gold resumed its rally, sparked by recent tarrif news. Price is pulling back at the moment and has entered an sweet spot where we can confidently take our first low risk Buy.
BUYING HERE BECAUSE
1. We're entering into a low volume area, which is also in line with an FVG on the 1hr chart
2. When a new uptrend starts, i like to buy first 2 instances price pullback to bounce from my trend cloud indicator We didn't get a perfect bounce as it has broken below it, but i'am still buying regardless due to my first reason above about the low volume gap.
PROFIT TARGET
Setting my profit target to my trusted Exofade peak. As long as the uptrend continues, Exofade peaks will ALWAYS get taken out. That why i love this indicator, and its free. It's my gift to y'all :) . Just search for it in trading view indicators.


Gold Pops the Channel and Retest Holding Strong Gold FuturesJust Broke Structure with Authority!
Gold smashed through the regular channel resistance with a surge in volume, confirming strong buyer intent. We’re now seeing a pullback retest right above the previous resistance — classic breakout behavior.
Here's what I’m tracking:
- Channel Break with Institutional Volume
- Retest holding above previous resistance = support flip
- Smart Money accumulation signs
- High-Probability Entry Zone forming for the next leg
This move aligns perfectly with the smart money model I use inside my private group — and historically, this setup has a 90%+ win-rate when confirmed with our rules.
Next Target Zones:
Buy-side liquidity zones
Imbalance fills
Next high timeframe swing point
I won’t reveal the entry rules here, but if you want the precise entry, SL, and TP for this setup:
👉 DM me “GOLD SETUP” or
📩 Join our GoldenZoneFX private signal group.
Real institutional setups. Real results. No fluff.
Follow for more smart money-based trade insights
Follow @GoldenZoneFX For more content and valuable Insights.


Gold is Setting up for a Move! Could it be a big one?Looking for price to set up for a solid move. One thing is for sure we are waiting for the killzones before taking any action. The price action the last few days has been giving fake outs just before we roll into the killzone. Be patient. Wait for things to line up.

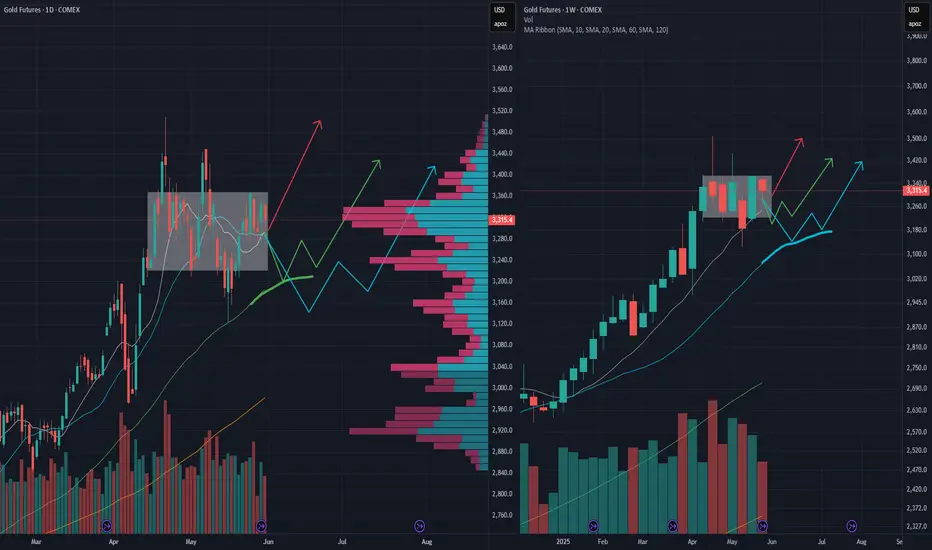
GC/GOLD bull rally setupHigh potential: looking for a 60 SMA support (~3200) in 2 weeks and then continue the bull rally (green path)
Medium potential: looking for a 20 weekly SMA support (~3140) in 1 month and then continue the bull rally (cyan path)
Low potential: directly break out next week (red path), but indicators do not quite support this case, so it may need some "external news"


Gold Looks Bullish. But need more confirmation! Looking for more supporting signs that gold is ready to go bullish. I think it will pull back first. But waiting to see where price is at inside of the killzone before making any decision on direction. Being that it is Monday price could end up acting flaky on action. So keeping expectations low.

What does the coming month implying?These are the questions that we should ponder:
1. Where are we coming off of? A Premium or Discount price?
2. Where is price likely to go?
3. Does the market have a reason to:
- Seek liquidity above or below the marketplace?
- Seek to mitigate inefficiencies?
4. How did Previous Month Candle close?
5. Do we have bullish or bearish Order Flow?
6. Does the correlated asset (ie. Silver) shows a crack or a change in the state of delivery?
7. Does the Fundamental support the Technical? Note: The shiny metal is an event driven asset.
I'm taking my time to study the Higher Time Frame chart to see the bigger picture, and keeping up-to-date with the current world event.
