SilverKey Observations:
1. Moving Averages (200 MA and 50 MA):
• 200 MA (Blue Line): The price is currently above the 200 MA, indicating a potential bullish trend.
• 50 MA (Yellow Line): The price is also above the 50 MA, reinforcing the short-term bullish sentiment.
2. Relative Strength Index (RSI):
• The RSI is around 60, indicating bullish momentum but not yet overbought. This suggests potential for further upward movement.
3. MACD (Moving Average Convergence Divergence):
• The MACD line is above the signal line, indicating bullish momentum. The histogram supports this with positive values, although there is a slight decrease suggesting a potential slowdown.
4. Bollinger Bands:
• The price has recently touched the upper Bollinger Band, indicating it might be overbought in the short term. This often suggests a potential pullback to the middle band (20 MA) or lower band.
5. Fibonacci Retracement Levels:
• 0.236 (30.94), 0.382 (30.59), 0.5 (30.31), 0.618 (30.03), 0.786 (29.61)
• The price is near the 0.236 Fibonacci level (30.94), which could act as resistance. The other levels serve as potential support if the price retraces.
6. ATR (Average True Range):
• The ATR indicates moderate volatility. This suggests that while there might be significant price movements, they are not extreme.
Comprehensive Technical Analysis:
1. Current Trend:
• The short-term trend is bullish as indicated by the price being above both the 50 MA and 200 MA.
2. Bullish Momentum:
• The RSI around 60 and the MACD indicate bullish momentum, but the slight decrease in the MACD histogram suggests monitoring for potential signs of weakening.
3. Key Support and Resistance Levels:
• Resistance: 0.236 Fibonacci level (30.94) and potentially the upper Bollinger Band.
• Support: 0.382 Fibonacci level (30.59), 0.5 Fibonacci level (30.31), and 0.618 Fibonacci level (30.03).
4. Momentum Analysis:
• The MACD indicates bullish momentum, but the slight decrease in the histogram suggests a potential slowing. This requires monitoring for signs of a bearish crossover.
Potential Buy and Sell Levels:
Buy Levels:
1. Support at 0.382 Fibonacci Level (30.59):
• If the price finds support around this level and shows bullish reversal signals, consider entering a buy position.
• Buy Level: 30.59
• Stop Loss: Below 30.50 (just below the support level to avoid false breaks)
• Take Profit: First target at 30.94 (0.236 Fibonacci level) and second target at 31.42 (previous swing high)
2. Lower Bollinger Band Area:
• Consider buying near the lower Bollinger Band for a short-term rebound.
• Buy Level: Around 30.30 (if the lower Bollinger Band is around this level)
• Stop Loss: Below 30.20 (to account for potential volatility)
• Take Profit: Middle Bollinger Band (approximately 30.80)
Sell Levels:
1. Resistance at 0.236 Fibonacci Level (30.94):
• If the price rebounds to this level and faces resistance, consider entering a sell position.
• Sell Level: 30.94
• Stop Loss: Above 31.00 (just above the resistance level)
• Take Profit: First target at 30.59 (0.382 Fibonacci level) and second target at 30.31 (0.5 Fibonacci level)
2. Middle Bollinger Band Area:
• If the price fails to sustain above the middle Bollinger Band, consider entering a sell position.
• Sell Level: Around 30.80 (if the middle Bollinger Band is around this level)
• Stop Loss: Above 30.90 (just above the middle Bollinger Band)
• Take Profit: First target at 30.30 (lower Bollinger Band) and second target at 30.03 (0.618 Fibonacci level)
Summary:
• Buy Levels:
• 30.59 (with stop loss below 30.50 and take profit at 30.94 and 31.42)
• Around 30.30 (with stop loss below 30.20 and take profit at 30.80)
• Sell Levels:
• 30.94 (with stop loss above 31.00 and take profit at 30.59 and 30.31)
• Around 30.80 (with stop loss above 30.90 and take profit at 30.30 and 30.03)
SIL1! trade ideas


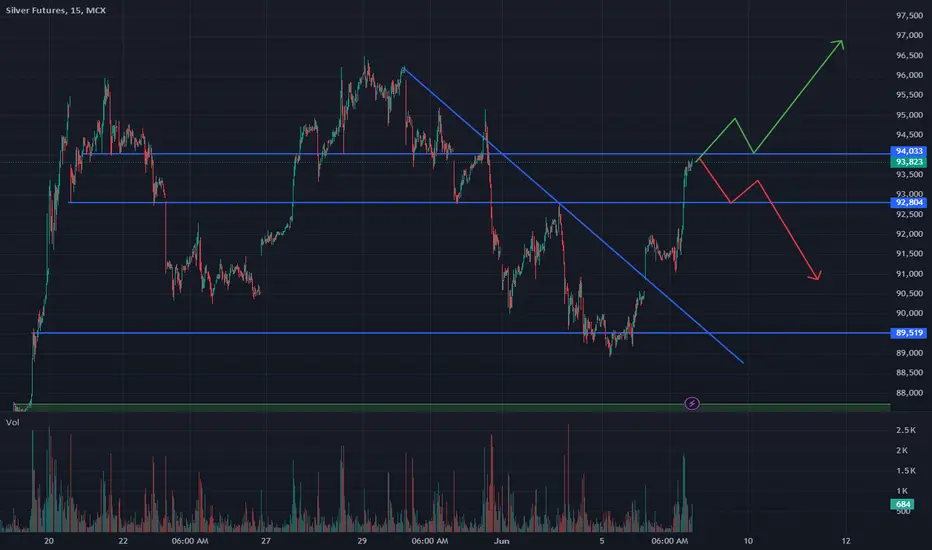
Silver Futures UpdateI posted an idea for silver futures last night, here's an update. Price gapped up above the descending trendline and held on a retest, which led to a large move. It's near an area of resistance now, so I'll be looking to see if it can keep going up and sustain above, or if it's going to fail again.
Silver Futures AnalysisMost of my ideas have been on the spot index for silver, but I use the futures to chart as well. Along with SLV, there's always another angle. I like the demand zone below for a short target..However, if it breaks above this trendline I'm gonna get out of the way,. It could go either direction at this point.


Chart Pattern Analysis Of Silver
K1 just break up the nearest highest price and the previous uptrend channel,
Perhaps it is in an accelerating status.
If the following candles consolidate here for days,
It is still a potential good place to buy in.
I think It is similar to XAU/USD and Copper/USD.
They are in a status of long-term Bull Market.
Long-31.1/Stop-30.6/Target-33.4


SILVER (XAGUSD, SIL1!) Daily Bias... BULLISH!You see we have a bullish BOS, it formed a +FVG, pulled back to the +FVG and the BOS, found
support and rallied towards the highs... forming another +FVG.
The expectation is for price to tag pull back into the +FVG and rally to the buy side liquidity.
If price runs the BSL before pulling back into the +FVG, then the probabilities of prices going
higher are significantly lower.


Silver's Rebound RoadmapGold (June) / Silver (July)
Gold, yesterday’s close: Settled at 2356.5, up 22.0
Silver, yesterday’s close: Settled at 32.137, up 1.638
Gold and Silver futures had a phenomenal start to the week but that momentum is stalling amid softness in the risk environment, U.S. Dollar strength, and a surge in yields. As I spoke in my evening video, I wanted Silver to get above $33 last night and set a new swing high; implying otherwise would be concerning. Here we are now, and what matters as today unfolds is the aforementioned outside market narratives and a constructive repose to support. Silver traveled the furthest to start the week and is clearly the local leader; it must hold out above the shelf created amid yesterday’s early whipsaw, now our first wave of major three-star support at 31.59-31.67.
Bias: Bullish/Neutral
Resistance: 2349-2350.5**, 2356.5***, 2363.7-2365.8**, 2372.2-2375***, 2385.3-2390.2***
Pivot: 2345.9
Support: 2339.2-2341.2**, 2333.8-2335.5**, 2322.5-2325.1***, 2304.6-1212.9***
Silver (July)
Resistance: 32.41-32.55***, 32.72-32.75***, 34.12***
Pivot: 32.05-32.19
Support: 31.89**, 31.59-31.67***, 31.37-31.42***, 31.10-31.15***, 30.83-30.92**, 30.50-30.56***, 30.19-30.27****
*Trade ideas cited above are for illustration only, as an integral part of a case study to demonstrate the fundamental concepts in risk management under the market scenarios being discussed. They shall not be construed as investment recommendations or advice. Nor are they used to promote any specific products, or services.
Futures trading involves substantial risk of loss and may not be suitable for all investors. Trading advice is based on information taken from trade and statistical services and other sources Blue Line Futures, LLC believes are reliable. We do not guarantee that such information is accurate or complete and it should not be relied upon as such. Trading advice reflects our good faith judgment at a specific time and is subject to change without notice. There is no guarantee that the advice we give will result in profitable trades. All trading decisions will be made by the account holder. Past performance is not necessarily indicative of future results.

Gold & Silver have done very well#GOLD & #SILVER have been on tear for some time.
Both showed bullish patterns & we took advantage of that.
GOLD
We've been long term holders of the shiny metal but we did take a chunk of the "paper gold" profits (stocks, contracts)
Want to step back in but RSI and $ flow have lost some steam, waiting.
Silver
Still looks pretty good.
Volume is still heavy for both = demand.
AMEX:GLD AMEX:SLV $PSLC AMEX:CEF


UPDATE: Silver trajectory remains up with target at $37If you place the regression channel you'll see Silver has been on an uptrend for the last few months.
We have had a Reverse Cup and Handle and the price has been above both 20 and 200MA...
So with the Zig Zags, the price will continue to move up until it reaches the first target at around $37.25.
Silver is the second type of safe haven that is common for investors to buy during risky market conditions. Simlar to gold - but is generally on a slower path up.


Silver: History May Not Repeat, But it RhymesGold (June) / Silver (July)
Gold, yesterday’s close: Settled at 2392.9, down 33.0
Silver, yesterday’s close: Settled at 31.496, down 0.582
The metals complex was bludgeoned yesterday and given the late session selling, settlement prices do not do it justice. While risk management becomes more important than ever during times of uncertainty, pullbacks or corrections can last longer than one is comfortable, it is also equally as crucial to back out of the forest to see the trees. It is a time like this that I am reminded that during Silver’s path to $50 in 2011, there were multiple corrections of $3 or more. In February 2011, Silver broke out above its December high of 31.27 and on the third session, stretched to a high of 34.33 before consolidating a day and plunging to a low of 31.69. There were four instances like this before Silver peaked at 49.82 on April 25, 2011.
Yes, our Bias remains more Bullish, and it becomes imperative for Silver to have a constructive path and hold out above our two waves of rare major four-star support. The first aligns the April high with the .382 retracement back to the May low at 30.19-30.27. Last night’s low was 30.36. In the case of additional pressures, we will look to a critical area at 29.50-29.72. If that is surrendered, the bigger broader narrative is bending.
Bias: Bullish/Neutral
Resistance: 2375.2-2377.8**, 2385.3***, 2389.6-2392.9***, 2398.9-2400**, 2408**, 2416.2-2417.4***
Pivot: 2369.7-2370.6
Support: 2356.8-2360.2**, 2349.8**, 2340.3-2343***, 2322.5-2325.1***
Silver (July)
Resistance: 31.18***, 31.28-31.32**, 31.50-31.61***
Pivot: 30.91-30.96
Support: 30.63-30.73**, 30.36-30.43**, 30.19-30.27****, 29.50-29.72****
*Trade ideas cited above are for illustration only, as an integral part of a case study to demonstrate the fundamental concepts in risk management under the market scenarios being discussed. They shall not be construed as investment recommendations or advice. Nor are they used to promote any specific products, or services.
Futures trading involves substantial risk of loss and may not be suitable for all investors. Trading advice is based on information taken from trade and statistical services and other sources Blue Line Futures, LLC believes are reliable. We do not guarantee that such information is accurate or complete and it should not be relied upon as such. Trading advice reflects our good faith judgment at a specific time and is subject to change without notice. There is no guarantee that the advice we give will result in profitable trades. All trading decisions will be made by the account holder. Past performance is not necessarily indicative of future results.


Silver Futures Under Pressure Yet Targets Remain Intact Today'sToday's silver futures are experiencing some pressure, reflecting a challenging day for the precious metal.
Yesterday, there were outflows in the portfolio on June 25 from strikes of 32.5/35. Outflows of funds from the portfolio are partial and did not lead to the liquidation of the portfolio, which indicates the management of the portfolio in a negative scenario, however, they do not cancel the most bullish idea in the medium and long term.
Despite this, the previously set targets based on the significant positions held by informed market participants mostly unchanged. in addition, it is not the first time that extremely aggressive portfolios appear, aiming at the area of 45-50 dollars.
It's a reminder that in the commodities market, short-term fluctuations are often just noise against the backdrop of longer-term trends and targets.

Defining the Next Leg in Silver and GoldGold (June) / Silver (July)
Gold, yesterday’s close: Settled at 2438.5, up 21.1
Silver, yesterday’s close: Settled at 32.426, up 1.167
Gold and Silver futures each set a fresh record high on Monday and have since consolidated in a large range, which is to be expected. This range is now well defined with major three-star resistance in Gold at 2448.8-2454.2 and Silver at 32.58-32.75; a failure to move out above here could certainly encourage some profit taking, but it also does not have to happen today. To the downside, a soft tape early yesterday and overnight has defined support to be 2408.5-2411.1 in Gold and 31.11-31.28 in Silver. While we do see a number of significant levels of support below here, a range extension to the downside would encourage a consolidation that could last over a number of sessions.
Bias: Bullish/Neutral
Resistance: 2436.9-2441.5**, 2448.8-2454.2***, 2494***
Pivot: 2426-2431.5
Support: 2417.4**, 2408.5-2411.1***, 2400**, 2391.7-2395.5***, 2385.3-2389.6***, 2375.2-2377.8***
Silver (July)
Resistance: 32.34**, 32.58-32.75***, 34.12***
Pivot: 31.69-31.85
Support: 31.11-31.28***, 30.73-30.79***, 30.39-30.43**, 30.00-30.19****
Check out CME Group real-time data plans available on TradingView here: www.tradingview.com
Disclaimers:
CME Real-time Market Data help identify trading set-ups and express my market views. If you have futures in your trading portfolio, you can check out on CME Group data plans available that suit your trading needs www.tradingview.com
*Trade ideas cited above are for illustration only, as an integral part of a case study to demonstrate the fundamental concepts in risk management under the market scenarios being discussed. They shall not be construed as investment recommendations or advice. Nor are they used to promote any specific products, or services.
Futures trading involves substantial risk of loss and may not be suitable for all investors. Trading advice is based on information taken from trade and statistical services and other sources Blue Line Futures, LLC believes are reliable. We do not guarantee that such information is accurate or complete and it should not be relied upon as such. Trading advice reflects our good faith judgment at a specific time and is subject to change without notice. There is no guarantee that the advice we give will result in profitable trades. All trading decisions will be made by the account holder. Past performance is not necessarily indicative of future results.
