COMPUSD trade ideas

Bullish signals invalidated - expecting more downsideThe current situation:
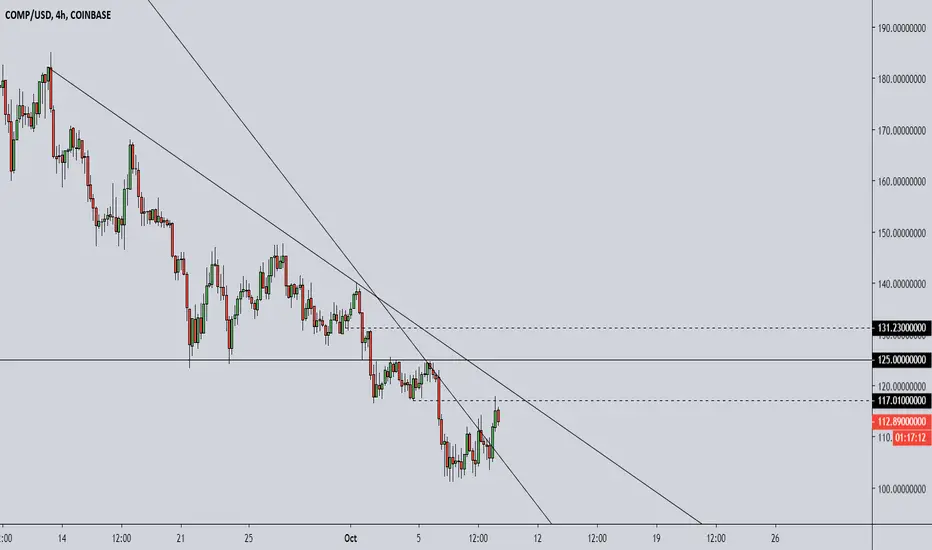
1. Price action previously formed a double bottom on the 4HR chart, but once it got to the neckline at about 124 USD, it was rejected and apparently does not have the strength to break out. Currently, it looks more like a double top with a measured move of 110 USD from the neckline at about 117 USD.
2. There was bullish divergence on the 4HR chart, but that did not seem to have played out strong enough to get above the double-bottom neckline.
The bullish case: price action retries and breaks the double-bottom neckline towards and goes towards the measured target of about 132 USD
The bearish case: price action breaks below the double-top neckline and goes toward the measured target of 110 USD
*Thank you to those who donated, I very much appreciate it.
*Let me know in the comment section if you agree or disagree, would love to hear your ideas too.
*These are purely my speculations and not financial advice. You should always do your own due diligence before trading or investing.

COMP.usd Near-term Support Resistance: Compound Retrace WatchMarket-wide pullback took Compound with it, but still remains bullish.
Mapped are Support and Resistance Zones to be observed for more clues.
Sure that is a lot of lines and zones, but each one WILL react so be ready.
$ 203.84 - 205.85 is KEY support that bulls really need to hold.
$ 189.01 - 191.33 is a possible target for a sub-200 Stop-Hunt wick.
$ 225.01 - 227.84 is key resistance to break to have any breathing room.


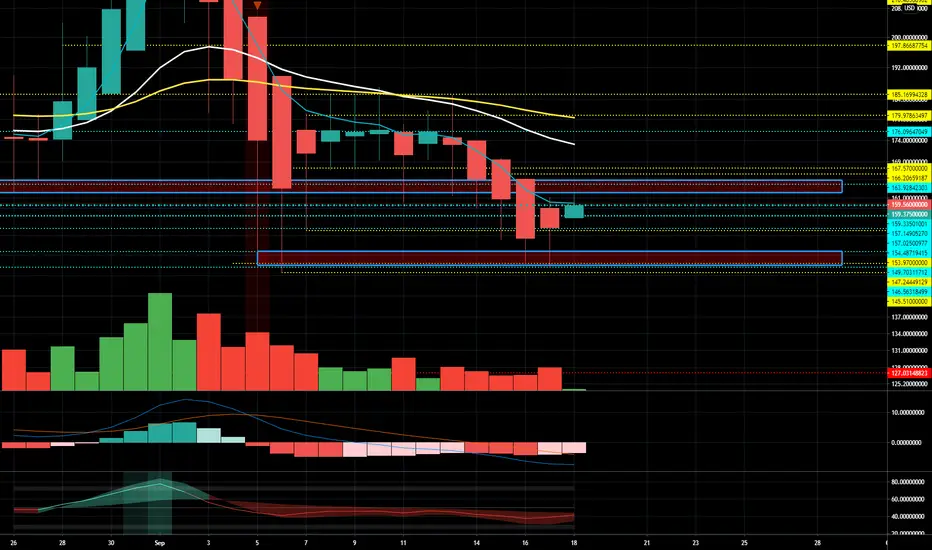
Sasquatch's 1hour COMPUSD Coinbase Day Trader Chart 4 Salt WaterI made this chart for an amazing day trading called Salt Water, Some friends of mine have been having tremendous success with this chart, Thanks to Lazy Bear the candles will fire white for sell and yellow for buy. Fib lines are purple and army green and are very powerful event predictors. Fib Fan Speed has been very accurate providing buy and sell areas to the tick. Great trend lines to trade from and all connected to Fibonacci. Enjoy this chart and pass along to any Compound traders. The thumbs up and down get bigger or smaller to show opportunities ,the bigger the greater the opportunity and vice versa. If any one out there needs custom charts please contact me for pricing. I will update this chart regularly so please check it often. Please post comments or suggestions below, I am an open book to feedback and a good listener. Thanks folks!!


COMP/USD (Retest Key Area of Support?)💎Technical Analysis Summary💎
FTX: COMPUSD
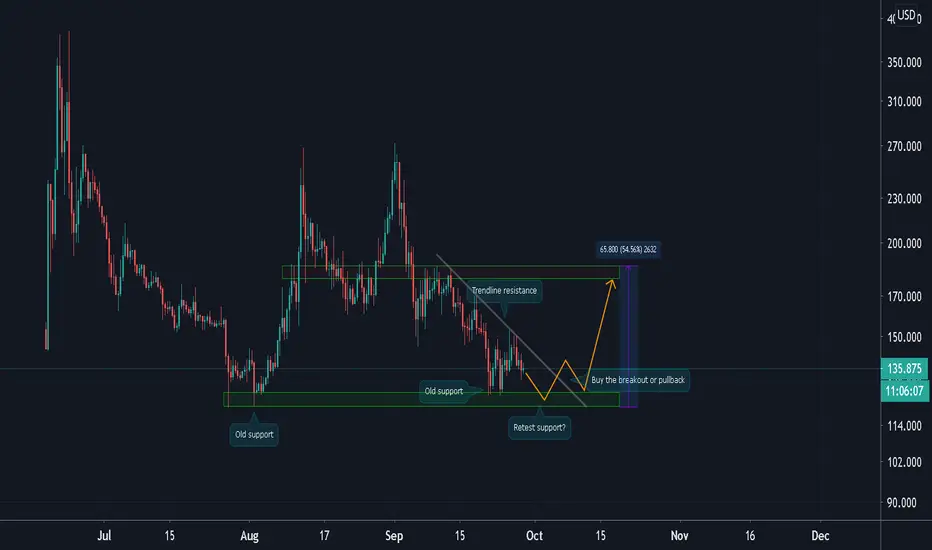
-Compound Token is unable to break the trendline resistance
-It is facing rejection and might retest key level of support at 120s area
-My advice is to wait for the proper upside breakout before planing your entry
-You may look to enter with momentum breakout or wait for a pullback
-The upside potential is up to 180s area of higher
``````````````````````````````````````````````
Trading Involves High Risk
Not Financial Advice
Please Exercise Risk Management
``````````````````````````````````````````````
If You Like My Daily Published Ideas
A little Help By Supporting My Channel
Through Leaving A Thumbs Up, Comment & Follow
Happy Trading! --> Thank You! :)
``````````````````````````````````````````````

Comp vs USD on Golden ratio*disclaimer* I don’t keep a position in this project so please do your own research. If you’d like updates on this TA, just leave a message below!
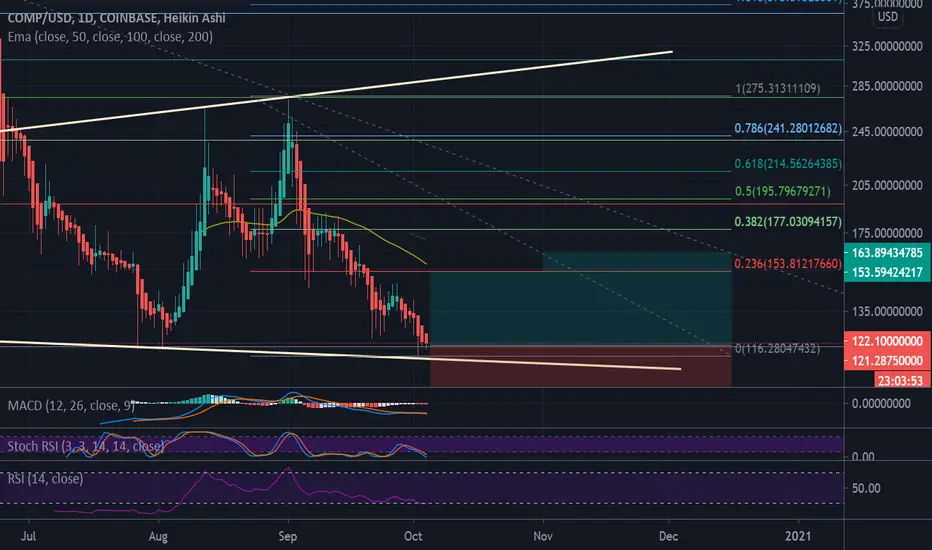
Following a healthy market correction of almost 50% price action finds support on the golden ratio (0.786).
Facts of the 1-day chart:
1) Stochastic RSI is oversold and indicating an increase in momentum. Bullish divergence is now visible on the 8hr chart (below), which complements the daily chart very nicely.
2) MFI resistance is broken just as before following an oversold period = bullish
3) The 1-day Bitcoin chart (bottom)is also showing healthy retracement with support on the golden ratio.
4) It is interesting with point (3) that price action now finds support on previous price action resistance (Orange line).
Good luck!
8hr USD chart
1-day Bitcoin chart

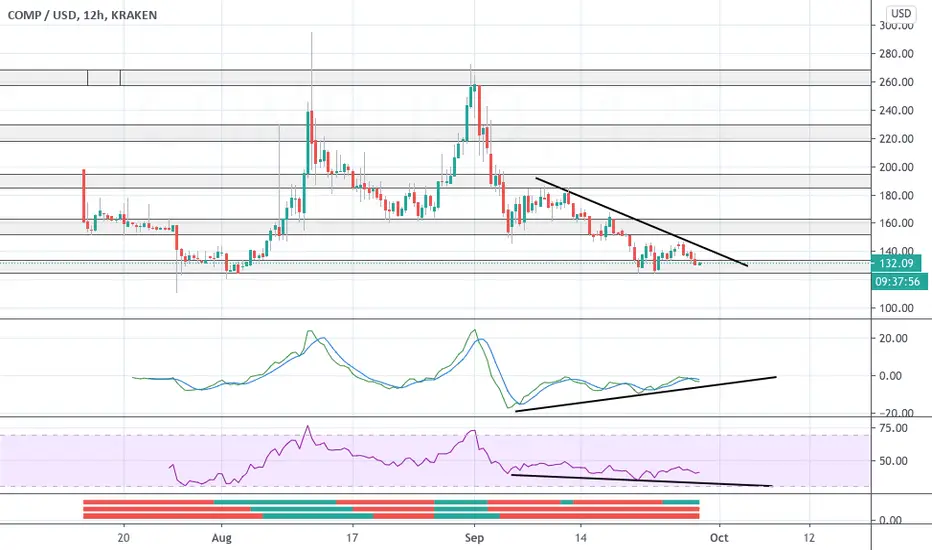
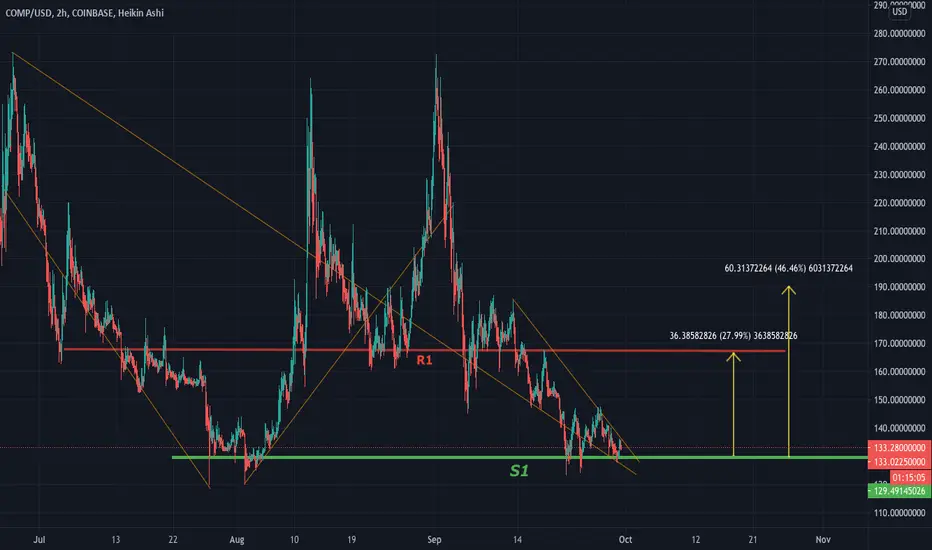
Bullish signs but will the market keep plunging COMP?There are double bottoms on all major time frames except the monthly and this is a bullish reversal pattern. The neckline is at about 145 USD and the measured target is at about 170 USD.
There is also bullish divergence on these major timeframes so if it plays out, it can be a catalyst for a reversal. But with the market conditions right now, it may or may not play out.
*Let me know in the comment section if you agree or disagree, would love to hear your ideas too.
*These are purely my speculations and not financial advice. You should always do your own due diligence before trading or investing.


COMPUSD guess again #4Looking to ultimately retest the local highs, with intermediate targets on the chart. The market as a whole looks very bearish, so I wouldn't be surprised to see it dip down to the $120 zone at some point, but the support here is reasonably strong so it should at least put up a fight. If the support in the $140s breaks down easily, it will erase my confidence in this setup.

COMP Inverted Cup & Handle - my first short?New to trading and still learning to properly chart, but spotted this inverted cup & handle that looks like it may play out soon for COMP.
Thinking of shorting the break down at $146, then measured move down to $110-120.
Am I think about this correctly?
Thanks. :)


Short Term Bearish On COMPUSD - PULLBACK PREDICTIONSCOMPUSD has been on a tear these 2 days and looks too overextended on the 12HRs and under hourly timeframes
The bearish case:
1. Market structure: price action got rejected at the 78.6% Fib level, which is at about 270 USD.
2. Volume: the rejection at 270 was with decent sell volume , which is at about the same volume with the previous 2 green candles.
3. RSI: in overbought territory on all major time frames up to the daily, bearish divergence is apparent on the 6 and 12HR
Prediction: expecting a pullback to at least the 240 level before making another attempt at the 270 level. If a fail attempt happens at 270 and a double top plays out, the measured move of the drop will be 210 USD.
The bullish case:
1. A successful attempt to breaking 270 , but the RSI on the 4, 6 and 12HR still need a cool down. So this is not a strong bullish case to me without a decent pullback.

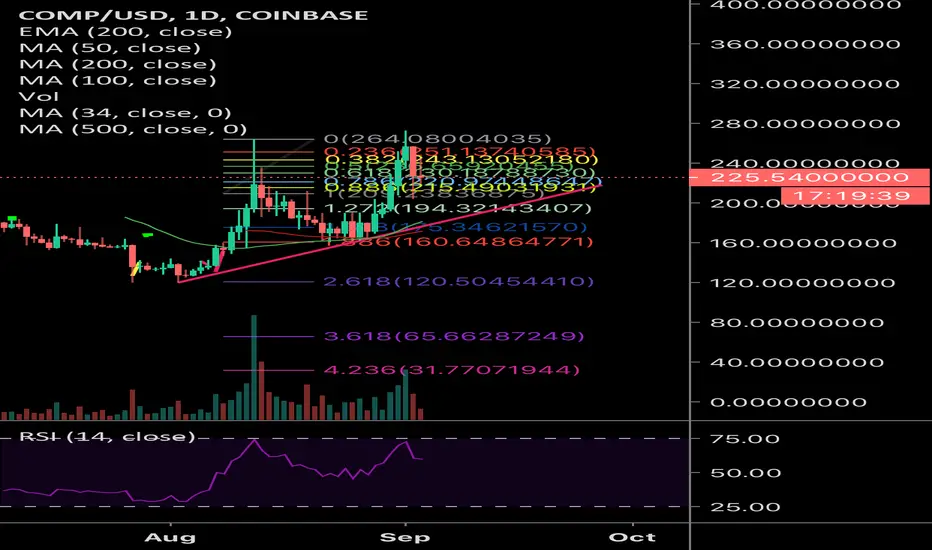
COMPUSD Setup - Market Structure, Volume & Checks Out For BullisCOMPUSD has broken out of the previous falling wedge pattern with a target indicated in the chart. It has also recently broken out of the larger timeframe moving averages as resistance. Volume shows increasing buyer volume on increasing price, with RSI on larger timeframes under 70, which makes the case it can go higher.