CTSIBTC trade ideas

Cartesi (CTSIBTC) breakout confirmed, 150% potential gainsCartesi breaks the downtrend with good volume. CTSI team is continuously working and releasing updates about the project. Cartesi has a lot of news coming in the next few months. We expect a good rally in CTSI anytime.
Buy Range: 265-270 (buy more if comes to 230-240)
Target: 299-325-365-395-430-470-520-580-640-700-790-880-950-1050 (Mid to long term targets)
Stop Loss: 179


Cartesi (CTSI) Bullish Breakout on High Volume (190%+)Cartesi (CTSIBTC) is moving just like we said the altcoins would move.
As Bitcoin, Ethereum and Ripple took a hit and move lower to test their first support, the smaller capped. altcoins are waking up bullish and starting to grow.
Here for CTSIBTC, we can see really high volume, bullish indicators, and prices moving above EMA50.
We look at EMA10 as the indicator to know if a pair has the potential to go down or up...
And we look at EMA50 to know if there is room for additional growth.
Once prices move above MA200, that's when we need that the bulls are strong.
CTSIBTC just conquered the first two barriers, EMA10 and EMA50.
Signaling that the trend can change in the coming weeks.
First, we saw prices dropping...
Then we saw some accumulation take place.
And now we will see higher prices as we witness the next bullish wave.
Namaste.

#CTSI/BTC C& H Breakout 114% + Potential PROFITWelcome to this quick update everyone.
BTC Dominance is falling and this is a good opportunity to trade some altcoins.
CTSI is amonG the coins which haven't pumped much yet.
Currently it is breaking out of a Cup and Handle Pattern.
It also broke out of the long term Falling wedge pattern.
It also broke above 21D MA 50D MA and 200D MA.
ENTRY : 245 TO 271
Targets :
321
351
383
481
571
Stop Loss : 227
Do your own research before investing
Please hit the like button if you like my work and share your views in the comment section.
Stay safe
#PEACE


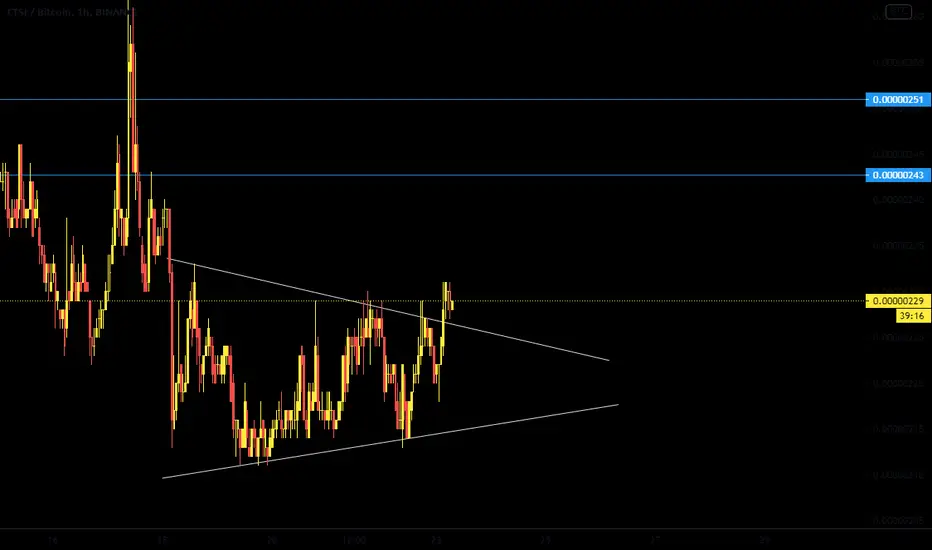

CTSI / BTC - Cartesi Trying to Break OutGreen line forming an inverted Head and Shoulders, yellow line forming a triple bottom.
A heck of a lot of room for a huge move up here, a conservative target marked with the purple line, zoom out and use fibs if this is confirmed by a move up after re-testing the yellow line and breaking above the purple line (mid-point of the first fib target).

CTSI/BTC SETUPChart Setup of #CTSI with BTC Pair
🎯🎯After the Trend Reversal, Just broke the first resistance at 212
Currently standing at 220 sat.
My analyses is, it will go back and stay its original support at 212 and then the volume will come back again, which will help Ctsi to break another 2 Important point.
235 and 249 accordingly...
This chart is for CTSI holders and Goodluck.

CTSI / BTC - Cartesi: W Pattern forming within a WConfirmed above the middle of either W shape (double bottoms forming on the short and long term charts) displayed above, with projected targets upon confirmation, stretch targets if the larger double bottom plays out.
Edit/Correction to chart: TP1 should be at the top of the solid small W instead of what's shown on the chart (approx 350 sats). That area on the chart should actually be what we need to get passed to confirm the pattern


CTSI / BTC - Is Cartesi printing a double bottom?Relatively new coin on Binance, not much history to go on. Marketcap is at 7.2 mln USD, volume has been super low - less than a million per day, ~198 million coins in circulation.
Seems like this has a lot of room to grow, let's see if it happens, a little volume could go a long way and very quickly.

CTSI/BTC (Bear Flag Confirmed)💎Technical Analysis Summary💎
BINANCE: CTSIBTC
-CTSI broke the key support area at 400s sat
-And confirms the daily Bear flag pattern
-If the Bears can send another follow-through
-The price could test the swing low support at 300s sat
-Please don't try to catch a fallen knife
-Wait for proper reversal confirmation
A big Thanks for donating 💰 via Tradingview coins this week to billstenzel 🙏🎉
``````````````````````````````````````````````
Trading Involves High Risk ⚠️
Not Financial Advice 💸
Please Exercise Risk Management 💱
``````````````````````````````````````````````
Thank You All!🙏😊💖For Supporting My Channel 📺
Through Leaving A Thumbs Up, Comment & Follow 💬
Happy Trading!😊💕💖
``````````````````````````````````````````````


CTSI Adam & Eve Pattern + Next Target At 155%+CTSIBTC is now mid-way through printing the Adam & Eve bottom reversal pattern...
When this pattern shows up, any correction is likely to reach its end before the pair resumes its growth.
The next target is marked here on the chart at 155%+.
Chart Signals for CTSIBTC by Alan Masters
Prices moving above EMA10 and EMA21.
Volume breakout.
MACD moving above the Signal line (bullish cross) with histogram going green.
Strong RSI.
This is another setup that looks pretty straight forward but is starting to look strong.
If CTSIBTC goes above EMA50, expect a strong bullish jump that hits our target or even more.
Namaste.


