4000% move for Cartesi (CTSI) in 2024?At this time the market is offering a few ‘fantastic’ opportunities for outstanding returns. Yet, if you’re tuning into social media you might believe the whole market is about to explode. As wonderful as that may be, this is not 2017. You have to be selective, disciplined and patient. If you think that’s you, read this:
On the above 2 week chart after 1100 days of downtrend we have:
1) Price action and RSI resistance breakouts. The price action breakout is also the first higher high since August 2020!
2) Support on past resistance. Blue arrows.
3) The Bull flag pattern confirmation forecasts a 4000% move in price action from 20 cents to $8 (see below).
4) Markets do not go up in a straight line. You'll have to tolerate the odd 30-40% correction until target. Those swings trade opportunities will be mentioned elsewhere.
Is it possible price action might correct further? Sure.
Is it probable? No.
Ww
Type: trade
Risk: <=6%
Timeframe for long: days
Return: 3000-4000%
Bull flag
CTSIUSDT.P trade ideas

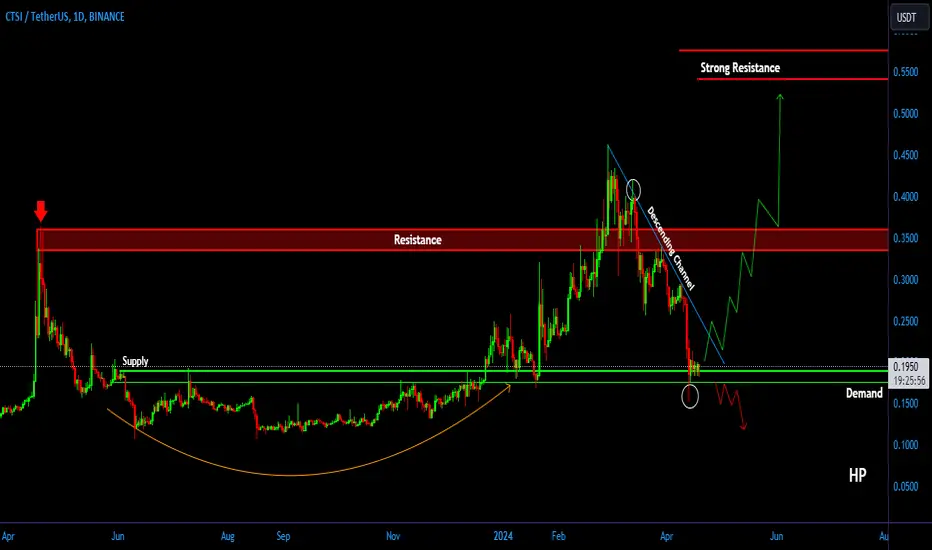
CTSI/USDT is potential revisit the demand before back to upward!💎 Paradisers, CTSI is indeed demonstrating intriguing movements that merit close attention.
💎 The successful breakout from the descending channel suggests bullish momentum for CTSI. Currently, the price appears poised to test the demand area around 0.195, which could serve as a launching pad for a significant upward movement, aiming to retest the supply area around 0.279.
💎 If CTSI manages to break above the supply area at 0.279, it could pave the way for further upward movement, potentially reaching our target strong resistance area.
💎 However, it's crucial for CTSI to bounce from the demand area to maintain bullish momentum. A failure to do so, and instead showing signs of consolidation or weakness, could lead to a breakdown below the demand area, signaling a potential continuation of the downward movement. In such a scenario, the price may revisit the key support area around 0.1515.
💎 When CTSI reaches the key support area, it's essential for it to bounce back and reclaim the price above the demand zone to sustain upward momentum. Failure to do so could signify a bearish trend shift, potentially resulting in further downward movement.
💎 Traders should closely monitor CTSI's price action around these key levels and adjust their strategies accordingly. A break below the key support area, confirmed by a daily candle close below it, would invalidate the bullish scenario and could lead to continued downward movement.
MyCryptoParadise
iFeel the success🌴

CTSIUSDT UPDATE #CTSIUSDT
UPDATE
Hey dear traders hope you are enjoying trading and analysis with our team. we are here to discuss about UNIUSDT
Falling wedge Breakout done in 1D time frame ✅
Expecting 100% profit in coming days 📈

2298% ROI on CTSICartesi (CTSI) is one of my favourite coins in which I believe because of their technology and community. It is decentralized infrastucture that supports Linux and mainstream software components. There are apps on their Blockchain OS like Creol, Simracer Coin, Dakai Locus etc. Also you can find prototypes for games like Texas HODL'em Poker and Creepts. This is trade (investment) setup on larger timeframe. I am not looking to reach targets 2,3,4,5 and 6 very soon, that could be year(s). I will sell most of my capital on targets 3,4,5. Small portion will be sold on Target 1,2 and 6.
Entry Zone: 0.119 – 0.1412
Buy Zone : 0.046 – 0.06
Target 1: 0.483 – 0.532 (251%)
Target 2: 0.781 – 0.846 (472%)
Target 3: 1.09 – 1.16 (703%)
Target 4: 1.66 – 1.74 (1117%)
Target 5: 2.46 – 2.59 (1709%)
Target 6: 3.22 – 3.36 (2298%)

CTSI/USDT i think price might go up
Remember to have entry orders in place to average this trade’s entry, and take 30% of profits in the first 2 Targets. After taking profits, move stops to entries or to breakeven levels. Keep in mind current market conditions and risk management.

CTSIUSDT UPDATE#CTSIUSDT
UPDATE
Hey all friends and traders. Hope you are enjoying our analysis. we are here to analyze CTSI today.
Falling wedge formation in 1W time frame .
Incase of Successfully breakout Expecting Massive Bullish wave📈

CTSIUSDT IDEAHello Trading view Family / Fellow Traders.
I hope you have used and benifited from the previous analysis .
In today trading session we are monitoring CTSIUSDT for a buying opportunity,
CTSIUSDT UPDATE
Falling Wedge Breakout Has Already done in 1D time frame ✅💥
Expecting Bullish Rally Towards 0.3600$ In next few Days💸💰☑️

CTSI/USDT in the crucial area is required to bouncing from here!💎 The recent market dynamics surrounding #CTSI have indeed been quite notable. Currently, the price is at a critical support demand area, where a bounce is necessary to sustain upward momentum.
💎 If the bounce proves to be valid, the next hurdle is breaking out of the descending channel. Achieving this would facilitate continued upward movement, potentially leading to a test of the next resistance level and ultimately reaching the strong resistance area.
💎 However, if CTSI fails to bounce from the demand area and instead breaks below it, this could signal a bearish momentum. Such a scenario could lead to continued downward movement, with the price likely to decline further.
💎 It's essential for CTSI to successfully bounce from the demand area to maintain the bullish momentum. Failure to do so could result in a bearish trend, potentially leading to further declines in price.
MyCryptoParadise
iFeel the success🌴
#CTSI +500% PROFIT IN Q1 2024#CTSI has Confirmed a Descending Channell Breakout and retest after a Long Consolidation.
Now, Bulls need Volume to PUMP it Hard 📈📈🚀🚀🔥🔥..

i see bullish momentum on Cartesi ( CTSI )i see bullish momentum on Cartesi ( CTSI ) targets and tps and Sl mentioned
lets see market prove me right or rong

CTSI/USDT Breakout Alert! Indicating Continue the Upward Move.💎 CTSI has made a significant breakthrough in the cryptocurrency market by successfully breaking out of the resistance rounding bottom pattern, indicating a bullish reversal movement.
💎 The price is currently undergoing a retest at the support level ranging from 0.354 to 0.324, with the potential to continue its upward movement towards our target area.
💎 However, if CTSI retraces back to the support area and fails to bounce, or worse, breaks down below this level, it could signify a false breakout.
💎 In such a scenario, there is a possibility that the price momentum will reverse, turning bearish and leading to a downward movement, potentially revisiting the demand area or even lower levels.

CTSI/USDT bullish reversal from key support? 👀 🚀CTSI analysis💎 Paradisers, get ready for an electrifying trading journey with #CTSIUSDT, now stationed at a pivotal support zone, hinting at an imminent market turnaround.
💎 An exploration of #CTSI recent movements reveals struggles to break past the resistance at $0.3825, suggesting potential bearish signals. However, preparations are underway for a bullish leap from the support at $0.3011, with sights set on overcoming future resistance hurdles.
💎 If the drive behind $CTSI begins to wane, we're prepared to witness a spirited resurgence from the key support level at $0.2523. Yet, a descent beyond this essential threshold could signal the onset of a more pronounced bearish trend.

CTSI/USDT I BUY SETUP✔︎📈 BINANCE:CTSIUSDT SIGNAL
✔︎ENTRY : 0.4068
🏓TARGETS :
✔︎T1 : 0.4319
✔︎T2 : 0.4570
✔︎T3 : 0.4880
✔︎Long term T4 - T5
✘STOP : 0.3817
🚦Stop Trigger:
• If you make capital management: Stop is activated when one candle opening and closing
below the stop level of the same time frame of the signal.
• If you don't make capital management: Stop is direct without waiting for the candle to close.
💡Risk management :
• Enter the trade with 10% to 20% of your capital to reduce risk and save cash to enter other opportunities.
• Sell (25% to 50%) on (T1) and don't move your stop-loss.
• Sell 50% on (T2) and move your stop loss to the entry point.
• You are safe now, and the next 25% is up to you.
💡Reason for this trade:
BINANCE:CTSIUSDT gives my trading system a sign of strength:
• My trading system is based on liquidity and reversal zones.
• When the liquidity is swept from one side under certain conditions, we will wait for the price on the other side.
The liquidity will attract the price like a magnet.
• the first side that has been swept:
1- failure swing point
2- retrace previous weekly low
• Opposite side targets:
1- buy side liq
2- pervious monthly high
💡Entry setup
1- reclaim mid range
⚠️WARNING:
• I'm not a financial advisor.
• Do your own research (DYOR).

CTSI After 2 Successfull Trade Here is The Third One## CTSI Coin: Short Fundamentals, Recent News, and Disclaimer
**Fundamentals:**
* **Cartesi (CTSI):** A blockchain platform enabling developers to build secure and scalable dApps (decentralized applications) with Linux capabilities.
* **Launched:** April 2018.
* **Market Cap:** ~$325 million (as of Mar 3, 2024).
* **Rank:** #200 on CoinMarketCap.
* **Unique Features:**
* **Linux Runtime:** Enables developers to use familiar tools and languages (e.g., Python, Java) for building dApps.
* **Optimistic Rollups:** Scalability solution to handle large transaction volumes and lower gas fees.
* **State Channels:** Secure off-chain computation for dApps requiring privacy or complex calculations.
**Recent News:**
* **Feb 23, 2024:** Cartesi announces roadmap for 2024, focusing on developer experience and ecosystem growth.
* **Feb 15, 2024:** Cartesi integrates with StarkNet Alpha for Layer 2 scaling.
* **Feb 10, 2024:** Cartesi releases roadmap for its decentralized oracle network, The Bridge.
**Disclaimer:**
* This information is for educational purposes only and should not be considered financial advice.
* Cryptocurrency investments are highly volatile and carry significant risks.
* Do your own research before making any investment decisions.
**Additional Notes:**
* CTSI price has seen moderate growth recently (+13.8% in the past week).
* The recent news highlights Cartesi's focus on developer adoption and scaling solutions.
* As with any cryptocurrency investment, carefully consider the risks involved before investing in CTSI.
I hope this information is helpful! Let me know if you have any other questions.

Where does it go?(CTSIUSDT W)BINANCE:CTSIUSDT The expected target is visible on the chart. If a second target is provided, it is likely to be achieved.

CTSI COIN 24HHello everyone, i have been looking into the CTSI coin. Really don't have much idea about it but i'm still making more research about it.
What is Cartesi (CTSI)?
Cartesi is a layer 2 optimistic rollup that seeks to overcome the issue of scalability and high fees on blockchains and take smart contract and dApp development to the next level. In simple terms, this means that it doesn’t run on a blockchain’s base layer, instead sitting on top of it in such a way that the smart contracts it runs can scale while still being secured by the blockchain.
By making sure dApps and smart contracts remain verifiable on the underlying blockchain while off-chaining the complex processes that would otherwise result in high transaction fees, Cartesi offers users the ability to run both scalable smart contracts and dApps that are coded with mainstream software stacks.
So i would really love to know what y'all think about it......Thanks

CTSIUSDT BULLISH IDEAPotential Bullish Entry
Dow Theory In Place - Higher High and Higher Low Expected in Place
The price action is traveling between a parallel channel and making HH and HL. It is expected the price action will take move upwards.
Bullish Trend Is Still Intact.
SL & TP Levels are defined.

CTSI/USDT If Break this resistance, CTSI will continue UP!💎 CTSI has recently witnessed significant developments in the market. Currently, CTSI is encountering a critical resistance area.
💎 If it successfully breaks through this resistance, it could trigger a bullish momentum, leading to a significant upward movement with the probability to reach our target at the strong resistance area.
💎 However, if CTSI fails to break through and shows signs of bearish rejection, similar to previous attempts, there is potential for the price to return to the demand area to establish new momentum.
💎 The demand area is of utmost importance and would require a bounce to maintain its bullish outlook. If CTSI fails to sustain above the demand and breaks below it, this could indicate a shift back to a downward movement, with the potential to return to the strong support area.

#CTSI/USDT#Ctsi
The price has been moving in a descending triangle since April 2022
It adheres to its limits to a large extent, and we are now on the verge of breaking it higher
With upward momentum supporting this
And strong support areas
Current price 0.2272
First target 0.2855
Second target 0.3665
Third target 0.4545

CTSIUSDT IDEAHello Trading view Family / Fellow Traders.
I hope you have used and benifited from the previous analysis .
In today trading session we are monitoring CTSIUSDT for a buying opportunity,
CTSIUSDT UPDATE
Moving Exactly As we Predicted Finally Hits Our Target 100% Profit Done in 3D time frame ✅ 💥

CTSIUSDT Double BottomCTSIUSDT Technical analysis update
CTSI price recently exceeded the neckline of a double bottom pattern on the day chart, accompanied by high volume, after a 675 days of consolidation this TA analysis indicate the bullish move.
Regards
Hexa

CTSIUSDT IDEAHello Traders Hope You Are Enjoying Our Analysis. Today We Will Discuss About CTSI
(Update)
The Symmetrical Triangle Has Breakout In 3D Timeframe✅
Ready For Massive Bullish Wave & Gain Good Profit In Coming Weeks✍️

Potential project:Our next guest is CTSI(run already sorry:/)BINANCE:CTSIBTC BINANCE:CTSIUSDT
Fundamental:ETH helper. Scaling Computation. Transcending EVM Limitations.✅
Technical:PO3 potential lvl.Full reach maybe 4x✅
Sentiment:Well hype project beacuse of the its airdrops.People don’t want to sell it.✅
