USDOLLAR H4 | Bearish dropUSDOLLAR is rising towards the sell entry which is a pullback resistance that is slightly above the 23.6% Fibonaccic retracement and could drop to the take profit.
Sell entry at 12,725.54, which is a pullback resistance that is slightly above the 23.6% Fibonacci retracement.
Stop loss is at 12,768
Dow Jones FXCM Dollar
12,807.59USDR
+116.17+0.92%
Last update at Feb 3, 2023, 21:59 GMT
USD
No trades
Key data points
About Dow Jones FXCM Dollar
The Dow Jones FXCM Dollar Index (short: DJ FXCM Index) is a currency index that tracks the strength of the US Dollar against a basket of the four most liquid currencies in the world. It is the product of collaboration between FXCM and S&P Dow Jones Indices. The index was designed to help traders assess whether the US Dollar is strengthening or weakening and is known for its transparency and simplicity. It reflects the change in value of the US Dollar measured against the basket of currencies: it rises when the US Dollar gains value relative to this basket and it falls when the opposite happens.
The basket contains the Euro, the British Pound, The Japanese Yen and the Australian Dollar in equal amounts, which are equally weighted. It is geographically balanced and accounts for 80% of worldwide Forex activity. The DJ FXCM Index was introduced on January 1, 2011, at a value of 10,000.00, is calculated every 15 seconds and updated Monday to Friday. It should not be mistaken for the much older and more complex US Dollar Index (DXY), which represents the weighted geometric mean of the US Dollar's value compared to six specific currencies. The weights were set according to trade weights and the Euro has the dominant weight in the DXY.
The basket contains the Euro, the British Pound, The Japanese Yen and the Australian Dollar in equal amounts, which are equally weighted. It is geographically balanced and accounts for 80% of worldwide Forex activity. The DJ FXCM Index was introduced on January 1, 2011, at a value of 10,000.00, is calculated every 15 seconds and updated Monday to Friday. It should not be mistaken for the much older and more complex US Dollar Index (DXY), which represents the weighted geometric mean of the US Dollar's value compared to six specific currencies. The weights were set according to trade weights and the Euro has the dominant weight in the DXY.


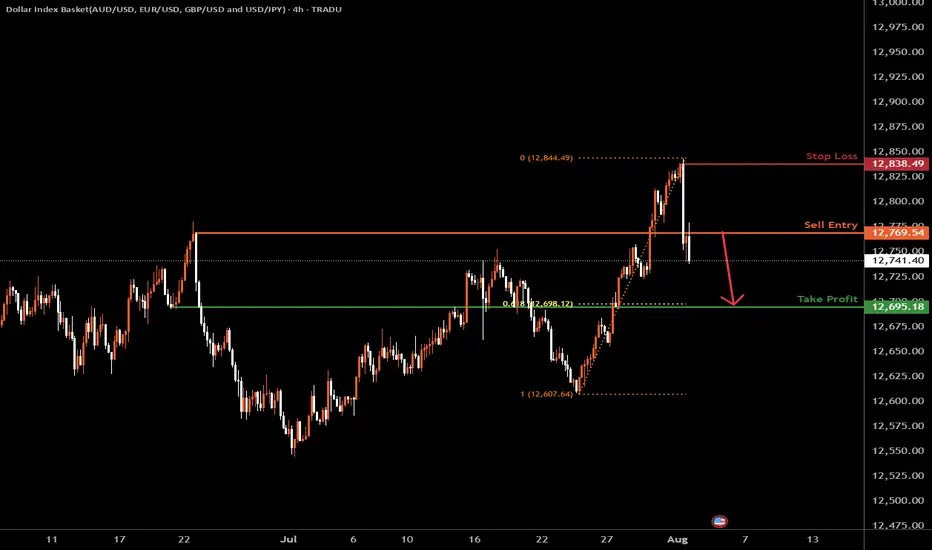
USDOLLAR H4 | Bearish dropBased on the H4 chart analysis, we could see the price drop lower from the sell entry, which is a pullback resistance and could drop to the downside.
Sell entry is at 12,769.54, which is a pullback resistance.
Stop loss is at 12,834.49, which is at 12,695.18, which is a pullback resistance.
Take
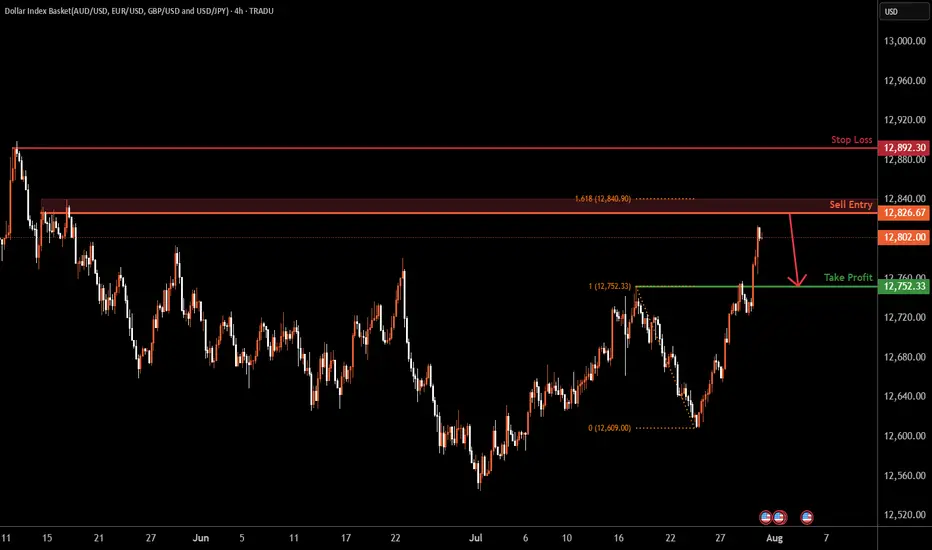
USDOLLAR H4 | Bearish reversalBased on H4 chart analysis, we can see the price rising towards the sell entry at 12,826.67, which is a swing high resistance.
Stop loss is at 12,892.30, which is a swing high resistance.
Our take profit will be at 12,752.33, which is a pullback support.
High Risk Investment Warning
Trading Forex
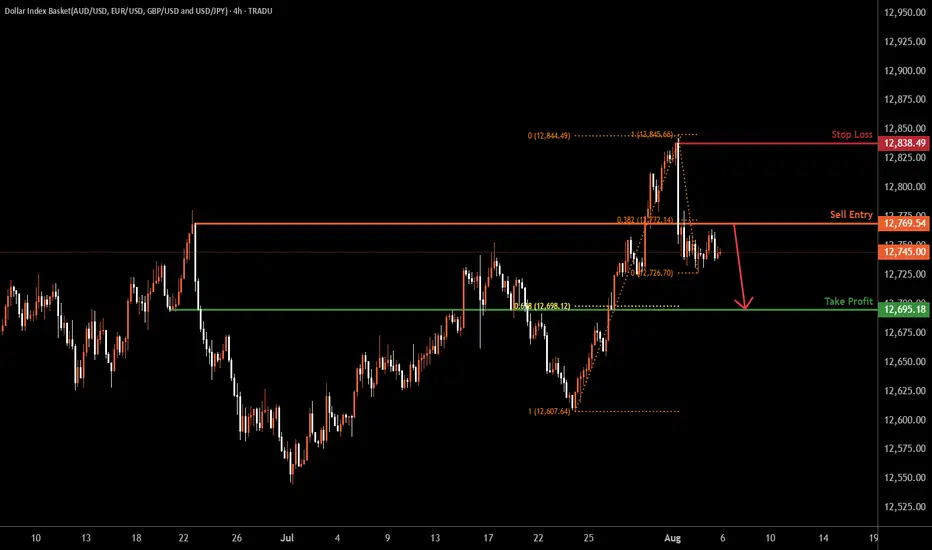
USDOLLA H4 | Bearish dropBased on the H4 chart analysis, we can see the price rise to the sell entry which is a pullback resistance and could drop from this level to the take profit.
Sell entry is at 12,769.54, which is a pullback resistance that lines up with the 38.2% Fibonacci retracement.
Stop loss is at 12,838,49, wh


See all ideas
Summarizing what the indicators are suggesting.
Oscillators
Neutral
SellBuy
Strong sellStrong buy
Strong sellSellNeutralBuyStrong buy
Oscillators
Neutral
SellBuy
Strong sellStrong buy
Strong sellSellNeutralBuyStrong buy
Summary
Neutral
SellBuy
Strong sellStrong buy
Strong sellSellNeutralBuyStrong buy
Summary
Neutral
SellBuy
Strong sellStrong buy
Strong sellSellNeutralBuyStrong buy
Summary
Neutral
SellBuy
Strong sellStrong buy
Strong sellSellNeutralBuyStrong buy
Moving Averages
Neutral
SellBuy
Strong sellStrong buy
Strong sellSellNeutralBuyStrong buy
Moving Averages
Neutral
SellBuy
Strong sellStrong buy
Strong sellSellNeutralBuyStrong buy
Displays a symbol's price movements over previous years to identify recurring trends.