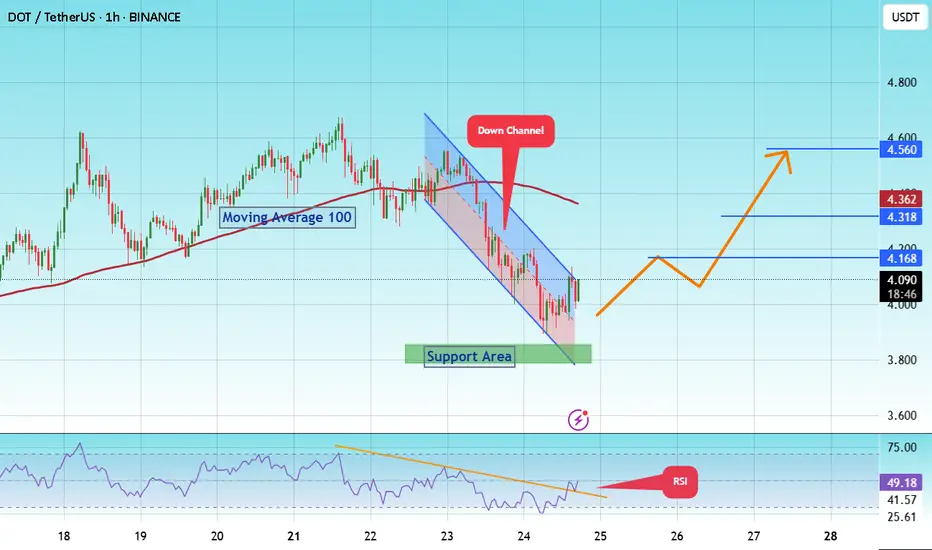
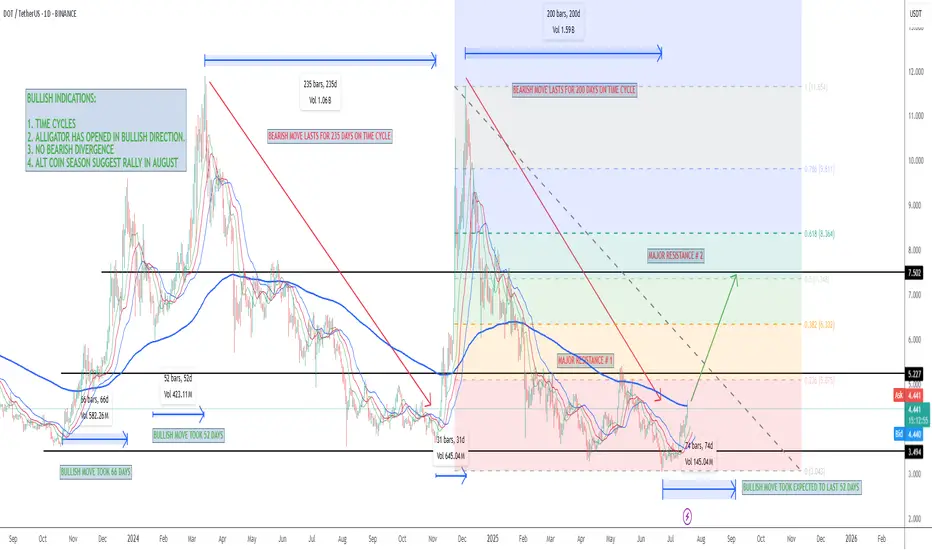
#DOT/Eyes 15% Rally, Targeting Key $ 4.560 Resistance Level#DOT
The price is moving within a descending channel on the 1-hour frame and is expected to break and continue upward.
We have a trend to stabilize above the 100 moving average once again.
We have a downtrend on the RSI indicator that supports the upward break.
We have a support area at the lower limit of the channel at 3,870, acting as strong support from which the price can rebound.
We have a major support area in green that pushed the price higher at 3,800.
Entry price: 4.084
First target: 4.168
Second target: 4.318
Third target: 4.560
To manage risk, don't forget stop loss and capital management.
When you reach the first target, save some profits and then change your stop order to an entry order.
For inquiries, please comment.
Thank you.
DOT 3x Long / Tether
0.004748USDTR
+0.000208+4.58%
As of today at 05:05 GMT
USDT
No trades
DOTUSDT.3L trade ideas
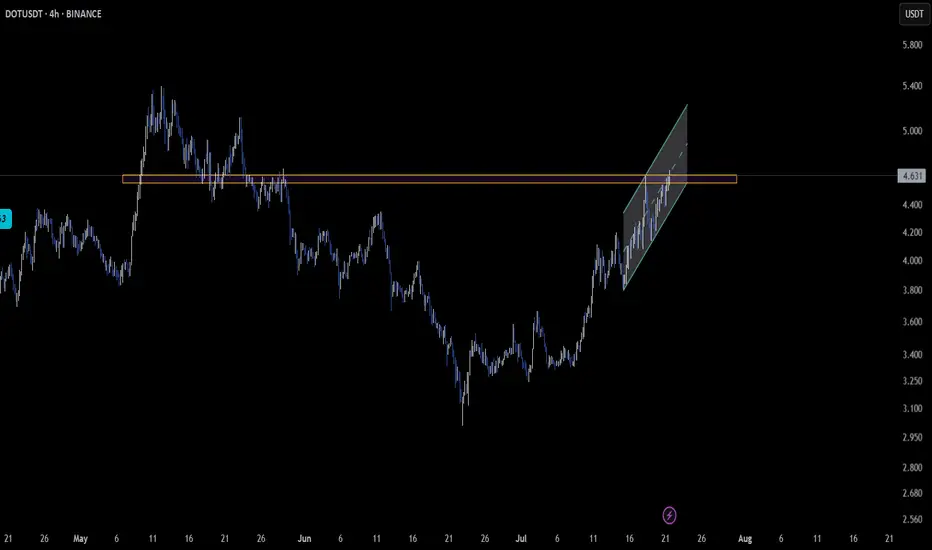
DOT – Structure Aligning Across Multiple TimeframesCRYPTOCAP:DOT is quietly setting up an interesting technical structure across different timeframes 📊.
On the 2-hour chart, price is gliding inside an ascending parallel channel, respecting both the upper and lower trendlines 📈. This clean structure often leads to smooth momentum-driven moves.
Zooming out to the daily timeframe, CRYPTOCAP:DOT is reclaiming a key support-resistance zone 🟢. This could indicate that bullish momentum is quietly building beneath the surface.
Traders should stay attentive—when multiple timeframes align, the probability of a decisive move increases 🚀.
DOT Bullish Outlook: $6.5, $9, and $12.5 AheadHello✌
Let’s analyze Polkadot’s upcoming price potential 📈.
BINANCE:DOTUSDT , I expect a long-term upward trend.
This analysis includes three main targets: $6.5, $9, and a final target of $12.5, which could be reached within 2 to 6 years.
Strong daily resistance and support levels are clearly marked on the chart, showing that the price is following a healthy and reliable path.
✨We put love into every post!
Your support inspires us 💛 Drop a comment we’d love to hear from you! Thanks , Mad Whale🐋
🐋Many of the points and levels shown on the chart are based on personal experience, feeling, and over 7 years of research and daily study of crypto charts.
Some of the lines, channels, and price zones are drawn to make the chart easier to understand and to help imagine possible future price movements.
I’ve also included one very big drop in price even bigger than the others because in the crypto market, it’s common for prices to suddenly fall hard and push out small investors and traders with positions.
The targets on the chart are not guaranteed; they might be reached, or they might not.📚
📜Please make sure to do your own research before investing, and review the disclaimer provided at the end of each post.


Polkadot Flips $4 — Here’s What Comes Next?DOT is quietly setting the stage... but will it deliver the breakout or fakeout?
After a strong bounce from the $3.35–$3.60 Fib support zone, Polkadot (DOT) has broken out of its downtrend line and flipped the $4.00 level into a support zone. The structure shows a bullish reclaim, but this isn’t a moon signal just yet.
🧠 The chart tells us:
DOT has tapped the key resistance zone around $4.62 (Fib 0.382), where previous sellers were active.
A rejection here could trigger a short-term pullback to the $4.00–$4.20 demand zone.
If buyers defend that level, we could see continuation toward $5.33 next.
A clean break and hold above $4.65 will likely open doors toward $5.60+.
Zoom out: This move is happening as altcoins begin rotating after Bitcoin's recent rangebound action. DOT is still inside a large accumulation range from February. Liquidity builds below $3.35 and above $5.30.
My expectation: Consolidation between $4.00–$4.60 may continue short-term. A deeper retest wouldn’t be surprising, but as long as DOT holds $4.00, the structure favors bullish continuation.
Resistance: $4.62, $5.33
Support: $4.00, $3.60, $3.35
Will DOT surprise the market and break this range?
#DOT #altcoinseason2025


DOTUSD BUY LONG DOTUSD BUY LONG Weekly bisi with EQL Liquidity
BullRun will starts it will going to moon for 4-5 month in daily tf .
Valid Mss with Valid Equal lows Liquidity our buying zone 3.4 $ - 3.5 $ target atleast 50-100 $
holding for 3-5 month from buying , deeply buying from this weekly bisi
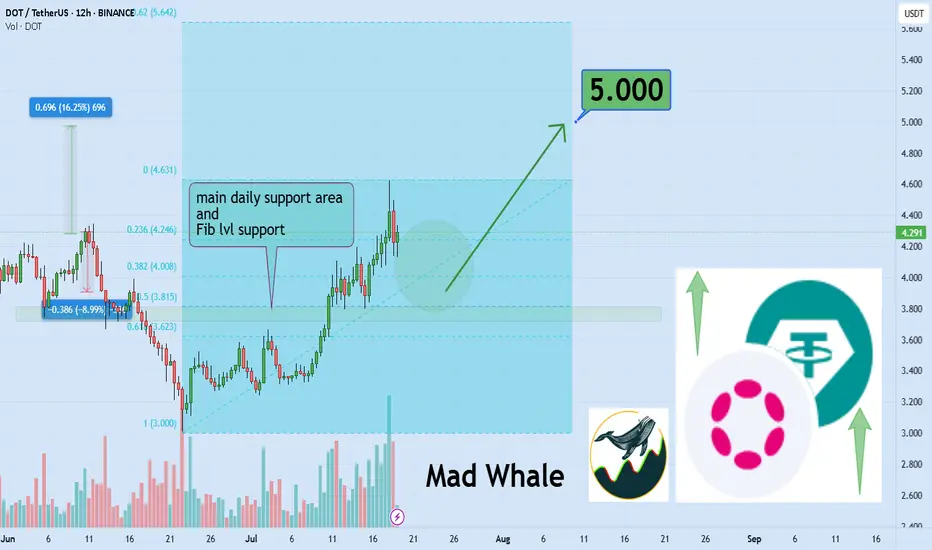
DOT Eyes 15% Rally, Targeting Key $5 Resistance LevelHello✌
Let’s analyze Polkadot’s upcoming price potential 📈.
BINANCE:DOTUSDT has broken above multiple daily resistance levels and is now consolidating near a key support zone. With this bullish structure in place, I'm targeting a minimum 15% move to the upside, with $5 as the main take-profit level. 🚀📈
✨We put love into every post!
Your support inspires us 💛 Drop a comment we’d love to hear from you! Thanks , Mad Whale 🐋
DOTUSDT - A Sleeping Giant in the Bull Market?Polkadot (DOT) has always been one of the leading assets during bull markets
A $10 target now seems inevitable after a clean breakout above the main trendline, followed by a successful retest.🎯
This $10 level has historically acted as a major resistance zone, often manipulated during each bull cycle — price touches it, then sharply pulls back.
But the big question is:
Will DOT break this psychological barrier this time?
Why not?
With many investors losing faith in the crypto market and considering leaving altogether, this might actually be the perfect setup for a massive price explosion.
Historically, the craziest pumps tend to come when confidence is at its lowest.🚀
Best regards Ceciliones 🎯

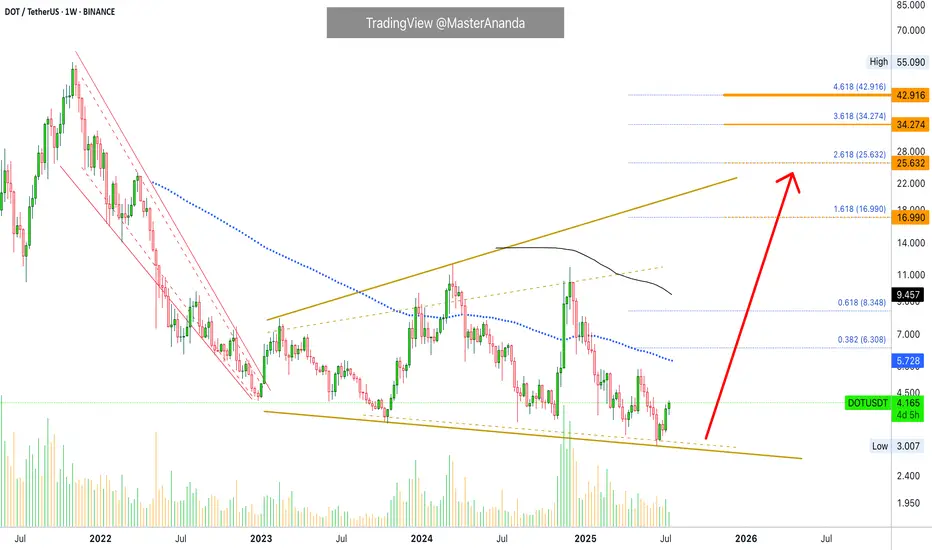
Polkadot Opportunity Buy Zone · Near Bottom · 2025 Bull MarketThis is what I mean: Opportunities are endless in this market. Compare Polkadot to say, Solana or Cardano which I shared just recently. Can you notice the huge difference?
First, Polkadot is still trading below EMA89 and MA200 weekly. Not to be taken as a bearish signal but instead to be interpreted as the pair being very early in its bullish cycle.
While Solana is trading ultra-high, super-strong, one of the strongest pair, which is bad if you want to go LONG (high risk with a small potential for reward), Polkadot is trading within the opportunity buy zone, very close to its bottom (low risk vs a high potential for reward).
I am a buyer. I am a Cryptocurrency fan. I am a bull.
So I want low prices and that is why low prices are good.
This is an opportunity, DOTUSDT. It is trading low now but it won't be trading this low for long, not even weeks. It is likely to start advancing within days. Once the bottom is gone it is gone forever. These altcoin projects will be the new tech giants and they will rise long-term. This is your chance. This is your opportunity for long-term trading success. Once you catch the bottom, you can't go wrong.
The chart is showing a long-term broadening channel. This is part of the transition period, from bearish to bullish, the consolidation phase. While the channel looks pretty big, the swings, if you activate the linear chart you can see the truth. Perspective. You will see a true bottom on the chart. From the bottom we grow.
When the action challenges the lower boundary of the channel, support; the market reverses, in this case Polkadot will start to go up. It is already growing. Several weeks rising. The upper boundary is the minimum giving us more than 425%. But we are not aiming for the minimum, we want high in the least, we want the maximum, so let's go for a new all-time high or just below the last one.
Namaste.
DOT/USDT Breakout Watch – Eyes on the $3.98 ResistancePolkadot (DOT) is forming a solid base and is now approaching a key resistance zone around $3.98. A clean breakout above this level could mark the start of a bullish reversal.
🔍 Technical Setup:
DOT is consolidating near resistance after a prolonged downtrend.
Breakout above $3.98 signals strength, possibly confirming a trend shift.
Volume spike and higher lows suggest accumulation.
🎯 Bullish Targets Post-Breakout:
TP1: $5.00 (psychological + structural level)
TP2: $10.00 (mid-range consolidation zone)
TP3: $15.00 (macro resistance, potential long-term play)
🛡️ Support to watch on pullbacks: $3.50–$3.60 zone.
Bias: Bullish above $3.98
Invalidation: Close below $3.50 with volume
Keep an eye on the breakout confirmation with volume and candle structure. DOT might be gearing up for a larger move if the market sentiment aligns.

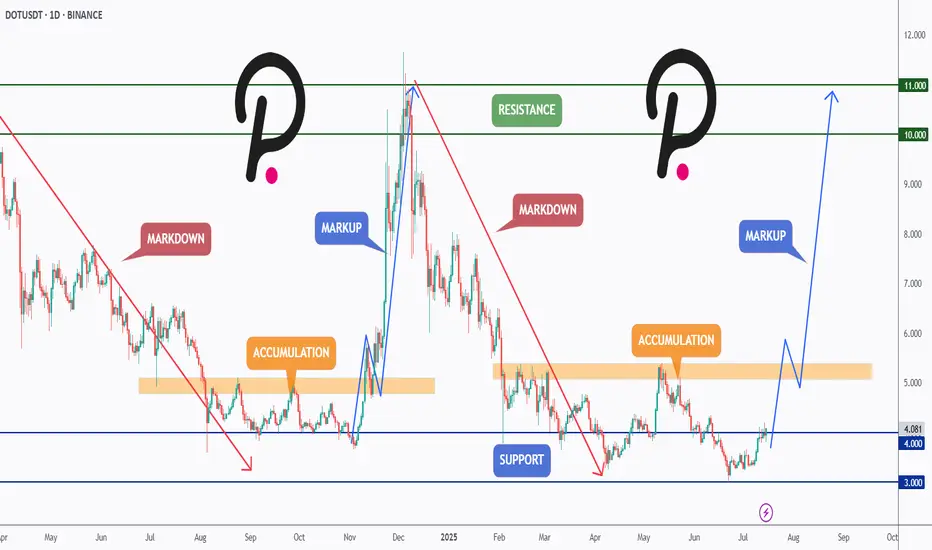
DOT Reloading for Takeoff ?CRYPTOCAP:DOT has been following a textbook Wyckoff cycle — moving from markdown into accumulation, followed by a sharp markup, then another markdown, and once again settling into a fresh accumulation zone.
After retesting the major support at $4 and holding above it, DOT is showing early signs of bullish momentum. If this structure continues, we could be preparing for another markup phase with potential targets at the $6, $10, and even $11 resistance zones.
This setup mirrors the previous cycle — will history repeat itself?
📍 Key Levels:
Support: $4.00 & $3.00
Resistance: $6.00, $10.00, and $11.00
Let me know your thoughts in the comments 👇
📚 Always follow your trading plan regarding entry, risk management, and trade management.
Good luck!
All Strategies Are Good; If Managed Properly!
~Richard Nasr

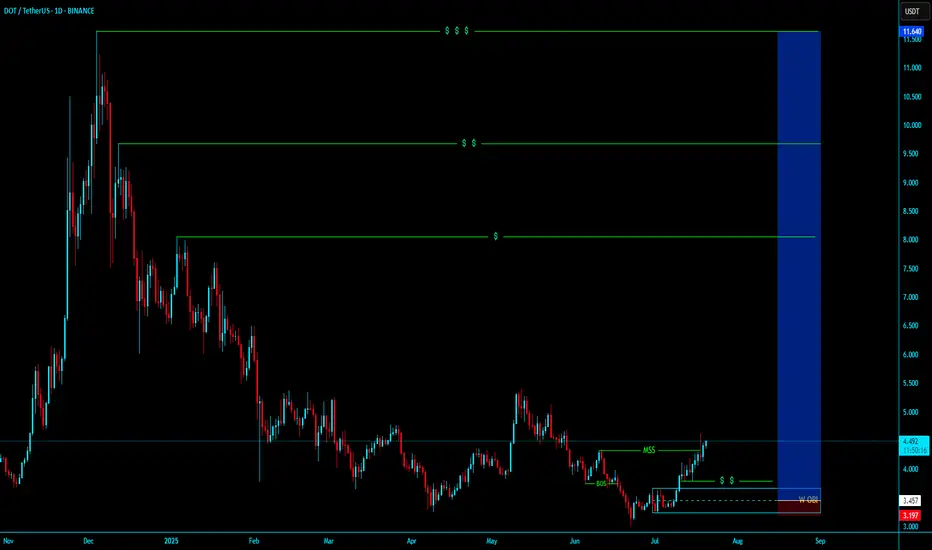
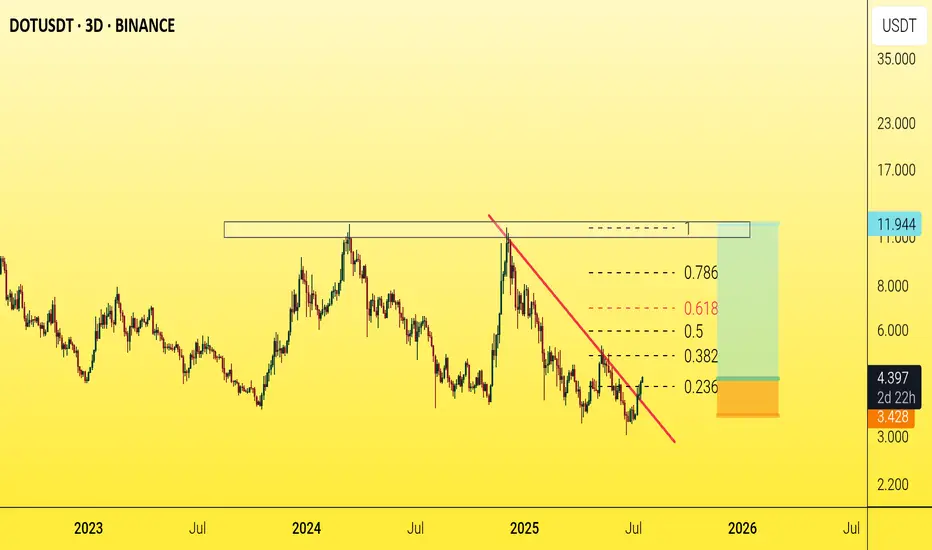
DOTUSDT – Spot 2025 Long-term Buy RecommendationDOTUSDT – Spot 2025 Long-term Buy Recommendation
Context: After a long period of accumulation, DOTUSDT previously attempted to break above $7, but that move was just a false bottom formation—a scenario we accurately anticipated with our advanced monitoring system.
Current Outlook: The Weekly (W) timeframe has now completed its bottom formation. It's time to continue accumulating DOT spot positions for the long term.
Trade Type: Long-term Spot Hold
Entry: Around $4 – price is already low, no need to bargain further.
Exit Strategy: Take profit based on peaks in the Weekly (W) or Monthly (M) timeframes—lock in gains progressively as new highs are formed.
Action: Start or continue accumulating DOTUSDT spot positions now.


Polkadot DOT price analysisAt night, only CRYPTOCAP:BTC impressively updated its ATH, while the rest of the altcoins... haven't really woken up yet after many months, if not years, of hibernation.
For example, if memory serves, in 2020, CRYPTOCAP:DOT was buying at $1.7-1.9 during the presale (please correct me in the comments if I'm wrong). Now, the price of OKX:DOTUSDT is not that far from the initial price.
🤪 It seems that no one believes in the ultra-fashionable #Polkadot “parachain” fairy tales anymore, and that is why if the price of #DOT rises again to $11-12, it will be super happiness and luck.
✈️ Well, dreams that #DOTUSD will cost $42 again can only be included after the price has firmly consolidated above $12, and with the current price dynamics, this is something at the level of fantasy.
_____________________
Did you like our analysis? Leave a comment, like, and follow to get more

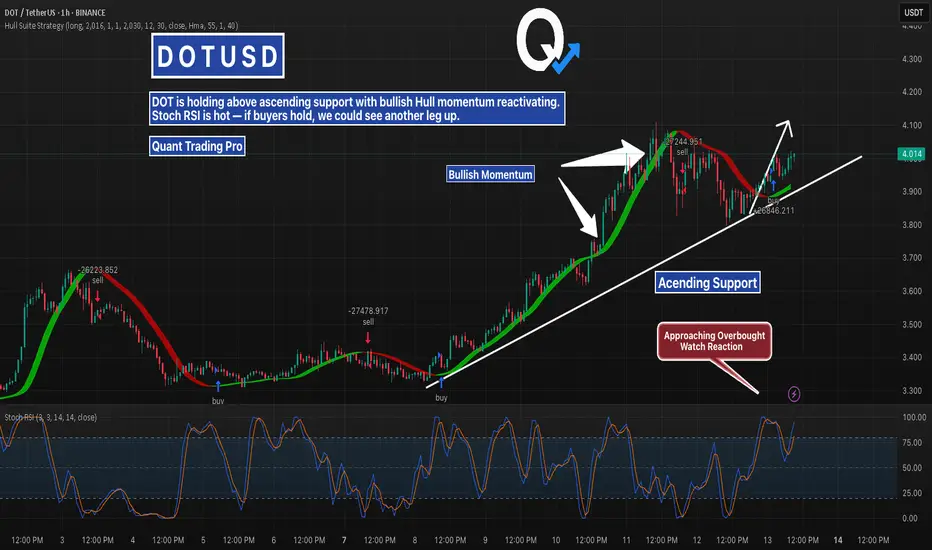
DOT’s Accumulation Zone Holding — History Rhymes?Polkadot (DOT) has respected the same support range for nearly a year, forming a long-term base around $3.50–$3.70. Previous bounces from this level have resulted in aggressive upside moves. With Stoch RSI now pointing up again and price pushing higher, DOT may be gearing up for another breakout attempt — potentially echoing its last major run.
#DOT #Polkadot #Accumulation #CryptoChart #QuantTradingPro #TradingView

$3.48 Is the Line in the Sand—If DOT Holds, Next Stop $4.35DOT/USDT has shifted from a persistent downtrend into an early-stage recovery after forming a clear base near the stronger support area at $3.294. This accumulation zone attracted steady buying interest, eventually fueling a breakout past the previous resistance near $3.531, which has now become a support level.
At present, DOT is trading around $3.688, showing healthy momentum as it approaches the first resistance area. The recent price action demonstrates a breakout–retest structure that typically signals a continuation of bullish sentiment as long as key support levels hold.
The Chaikin Oscillator at the bottom confirms this accumulation phase, with sustained green histogram bars indicating that buying volume is building steadily. The indicator flipped positive before the breakout and continues to support the bias that bulls are in control on this timeframe.
There are two critical resistance zones ahead: the first around $3.974, which marks an interim profit-taking level, and the second near $4.345, a stronger barrier where sellers are likely to appear. If price closes above this higher zone with conviction, it would further confirm that the market has transitioned into a new bullish trend.
Trade Idea (Long Bias)
• Entry: Current area near $3.68 or on a small retracement toward $3.63–$3.60
• Stop-Loss: $3.480, placed just below the weaker support to protect against a deeper reversal
• Target 1 (TP1): $3.974, where partial profits can be secured
• Target 2 (TP2): $4.345, a more ambitious target aligning with the upper resistance
• Reward-to-Risk Ratio: Approximately 3.3, offering a favorable setup
As long as DOT stays above $3.531 and does not violate the $3.480 stop level, this bullish structure remains intact. If the price drops back below $3.480, it would suggest that the breakout has failed, increasing the likelihood of a retest of the accumulation zone around $3.294.
Overall, the combination of structural breakout, retest, and strengthening momentum indicators supports the idea that DOT may continue climbing toward the upper resistance levels over the next several sessions.

DOT/USDT Weekly Accumulation or Annihilation?📌 Overview & Market Context
Polkadot (DOT) is currently testing one of the most critical technical zones in its price history. Price action is revisiting a multi-year demand zone between $2.70 and $3.60, which has previously served as the springboard for explosive upward moves — including the 2021 rally to all-time highs near $55.
This weekly chart reveals that DOT may be transitioning from a prolonged downtrend into an accumulation phase, often seen before major bullish expansions.
🧱 Historical Support Zone & Technical Validation
🔹 The yellow demand zone ($2.70–$3.60) has acted as a strong support multiple times since 2020.
🔹 Price has once again bounced from this area, forming a potential triple bottom or accumulation base pattern, consistent with Wyckoff Accumulation Theory.
🔹 A confirmed bullish candlestick (e.g., bullish engulfing, hammer, or long-tail doji) on the weekly timeframe could signal early institutional accumulation and a potential macro trend reversal.
🟢 📈 Bullish Scenario: Strong Reversal Potential
If DOT successfully holds this support and forms a higher low, we could see a multi-leg bullish breakout, targeting the following resistance levels:
🎯 Target Price Level Significance
TP1 $4.75 First structural breakout
TP2 $5.88 Minor historical resistance
TP3 $7.63 Previous consolidation zone
TP4 $10.37 Major weekly resistance
TP5 $12.49–14.00 Extension zone during strong rallies
🧠 Note: A move from the current level to $14 represents a potential 250%+ upside — a major opportunity if confirmed by momentum and market sentiment.
🔴 📉 Bearish Scenario: Breakdown from Historic Support
A clean break below $2.70 with high volume would invalidate the bullish setup and signal:
Breakdown from a multi-year base structure.
Possible entry into a new bearish price discovery phase.
Next psychological support at around $2.00 or lower.
This scenario could materialize if:
Bitcoin or broader crypto markets turn bearish.
Macro factors worsen.
No strong demand appears from long-term holders.
⚖️ Strategy & Investor Insights
Swing Traders: Consider aggressive entries near current levels with tight stops below $2.70.
Mid-Term Investors: This is an ideal zone for DCA (dollar-cost averaging), with attractive long-term risk-reward.
Confirmation Needed: Watch for structure breakouts above $4.75 and momentum from RSI/volume indicators.
🧠 Market Psychology: Fear Breeds Opportunity
DOT is currently in what can be described as the “boredom phase” — the stage in market cycles when most traders have given up, and smart money quietly accumulates.
As Warren Buffet famously said:
> “Be fearful when others are greedy, and greedy when others are fearful.”
#DOTUSDT #Polkadot #CryptoReversal #AltcoinSetup #TechnicalAnalysis #SmartMoneyMoves #AccumulationPhase #SupportZone #BullishCrypto #BearishBreakdown
