The ISM chart tracks the business cycle.Every crypto peak aligns with the expansion phase & the top of the business cycle.
Every expansion also aligns with the central bank’s debt refinancing cycle.
This is your altcoin season road map.
United States ISM Purchasing Managers Index (PMI)
48.5POINTR
−0.2−0.41%
As of Jun 2, 2025
POINT
No trades
Key data points
Last release
Jun 2, 2025
Observation period
May 2025
Next release
Jul 1, 2025
Forecast
—
Highest
77.50 POINT on Jul 31, 1950
Lowest
29.40 POINT on May 31, 1980
About United States ISM Purchasing Managers Index (PMI)
The Manufacturing ISM Report On Business is based on data compiled from purchasing and supply executives nationwide. Survey responses reflect the change, if any, in the current month compared to the previous month. For each of the indicators measured (New Orders, Backlog of Orders, New Export Orders, Imports, Production, Supplier Deliveries, Inventories, Customers' Inventories, Employment and Prices), the report shows the percentage reporting each response, the net difference between the number of responses in the positive economic direction and the negative economic direction, and the diffusion index. A PMI reading above 50 percent indicates that the manufacturing economy is generally expanding; below 50 percent indicates that it is generally declining.
No news here
Looks like there's nothing to report right now
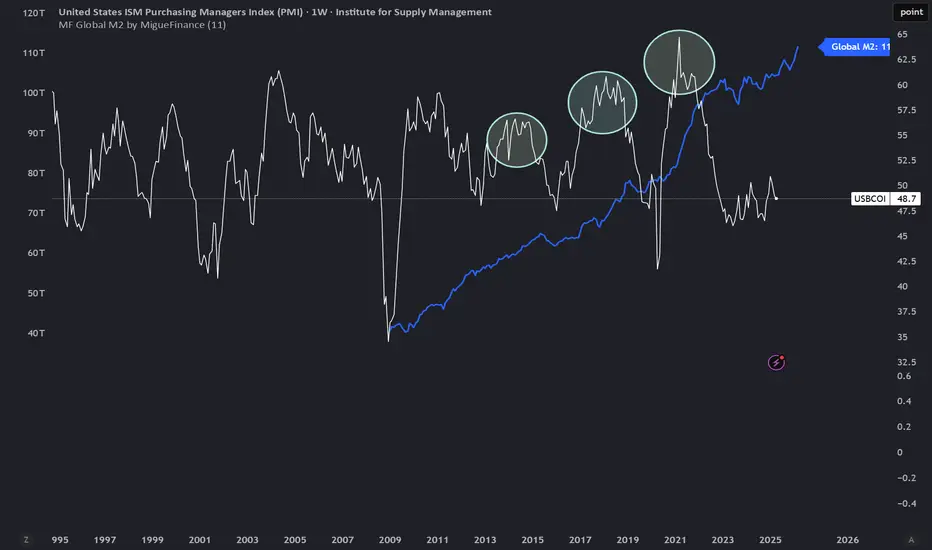
Crypto is correlated to the 4 yr business cycleISM survey results show 4 distinct phases (seasons)
we are in the beginning of the expansion phase when ISM ticks up, and crypto, benefiting from all the newly injected liquidity, benefits
This chart shows the last few cycles for comparison, and to illustrate that 2021 was a shortened cycle because


ISM INDEX Measured against Altcoin Marketcap + ETH Marketcap
So the ISM Index measures business activity in the US. When it's above 50 it suggests expanding economy.
No one is really talking about this but I heard max shillboi Raoul Pal mention it.
Could be a useful early signal for when it goes above 50. Seems to line up well with Altcoin boomboom.
Blue

PMI/FED FUNDS RATE/EURUSDUS economy shows signs of weakening, and a Purchasing Managers' Index (PMI) still below 50, this can be one such signal. A PMI reading below 50 indicates contraction in the manufacturing or services sectors, suggesting slower economic activity and potentially rising unemploymentboth of which could p


ISM Manufacturing & ISM Services PMI Combined show trigger levelISM Manufacturing and ISM Services PMI Combined 🪢
This week the ISM PMI's were released as follows:
🚨ISM Manufacturing PMI = 47.2 (contractionary)
✅ISM Services PMI = 51.5 (expansionary)
With both metrics offering mixed signals, I decided to make a chart that combines the ISM Manufacturing and

ISM Manufacturing PMI is below recession range of under 50The ISM Manufacturing PMI is below recession range of under 50, pointing to a contraction in the US manufacturing sector.
Market is not yet as healthy as the equity market would elude to.
Something to keep an eye on to check in on the health of the US economy

ISM Indices vs. GDP YoY% - Leading Economic IndicatorsBoth ISM Manufacturing Index and Non-Manufacturing Index vs. GDP YoY% for the US economy.
ISM Manufacturing: Yellow
ISM Non-Manufacturing: Blue
GDP YoY%: Green/Red
ISM Manufacturing currently signaling contraction with a level below 50 and the momentum seems lower.
Non-Manufacturing Index is lik

recovery of the manufacturing cycleAfter more than a year of manufacturing PMI stay below 50, meaning the manufacture activity is below average, recently (start Oct 2023) the manufacturing PMI seems recovering in US, UK, France, Italy, Greece. and if manufacturing is getting better, oil demand should be elevated and so the oil price.

See all ideas
Related indicators
USACR
API Crude RunsR
91 KBLL
USAHO
API Heating OilR
−470 KBLL
USBCOI
Business Confidence IndexR
48.5POINT
USBOI
NFIB Business Optimism IndexR
98.8POINT
USBR
BankruptciesR
23.11 KCMPNY
USCAP
Car ProductionR
10.43 MUNIT
USCAR
Car RegistrationsR
252.6 KPSN
USCCOS
Cushing Crude Oil StocksR
−403 KBLL
USCI
API Crude ImportsR
954 KBLL
USCLI
Composite Leading IndicatorR
100.29POINT
USCN
API Cushing NumberR
−800 KBLL
USCOI
Crude Oil ImportsR
451 KBLL
USCOR
Crude Oil RigsR
439UNIT
USCORPI
Corruption IndexR
65POINT