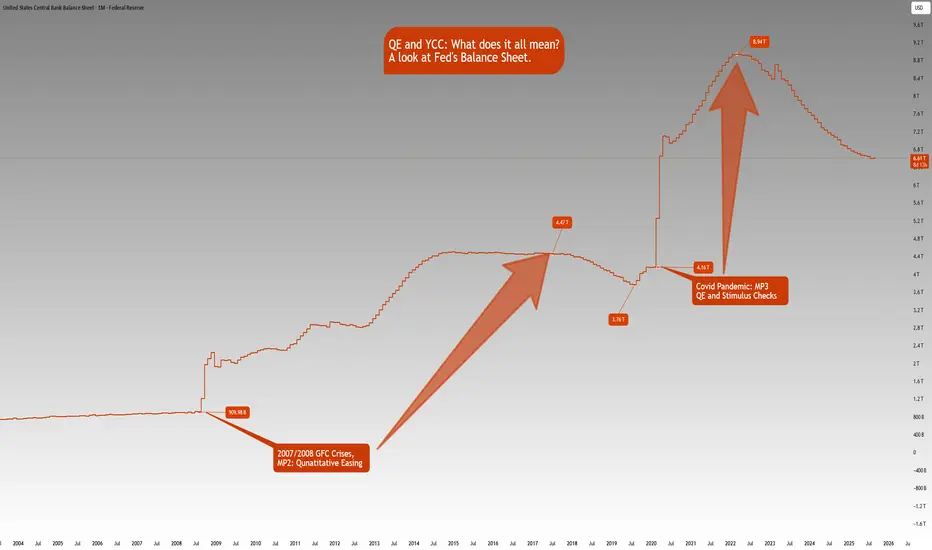
QE and YCC: What does it all mean?ECONOMICS:USCBBS
CBOT:ZB1! CBOT:ZN1! CME_MINI:NQ1!
There is growing market speculation that the Fed may tolerate inflation above 2% for longer, consistent with its Average Inflation Targeting (AIT) framework introduced in 2020.
This also implies that real rates i.e., nominal rates minus
Key data points
Last release
—
Observation period
Sep 24, 2025
Next release
—
Forecast
—
Highest
8.97 T USD on Apr 13, 2022
Lowest
712.81 B USD on Jan 29, 2003
About United States Central Bank Balance Sheet
The Central Bank Balance Sheet represents the total assets held by a central bank. It reflects the scale of monetary policy actions, including holdings like government securities, foreign reserves, and loans to banks. Changes in the balance sheet indicate shifts in policy, such as easing or tightening financial conditions.
Related indicators
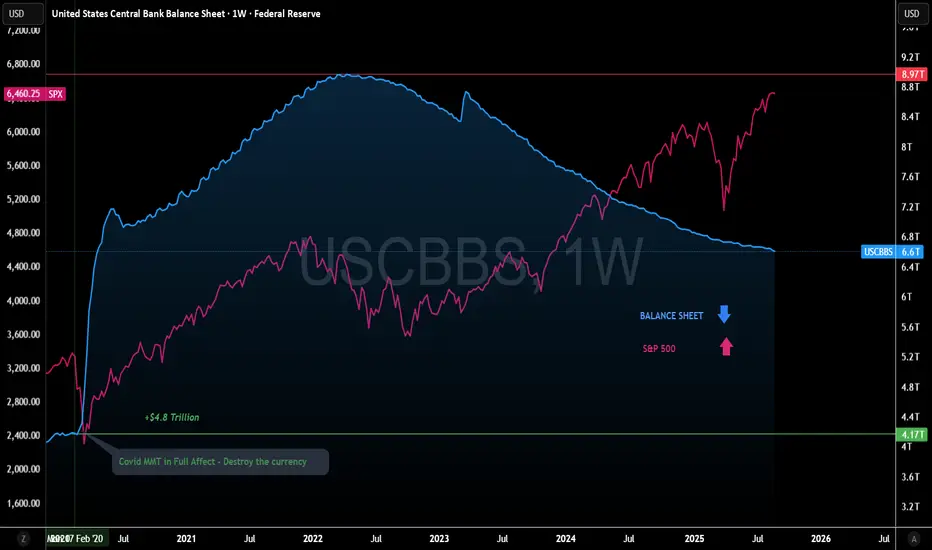
Federal Reserve Balance sheet vs SPXFed Balance sheet vs SPX
Its amazing to see the S&P500 breaking away from a long term correlation.
The Fed Balance sheet has shrunk from $8.97T to $6.6T but the markets have not been fazed.
Historically reductions in the balance sheet have resulted in markets selling off.
This time we are obs
QE USCBBSWhen it rises up, it is a good idea to buy store of value assets, as this is a sign of depreciation of the $.
*DYOR*

The Printing Company- how it works :
- Imagine you can create apples, and that you are the only one in the world able to do that.
- So if you create 100 apples, you will make them more rare and unique, so maybe you can sell them for 10$ each one.
- So now imagine you create 10,000,000,000 apples, you will have more ap

Global Net LiquidityGlobal net liquidity is described by Fed Balance Sheet - RRP - TGA + BoJ Balance Sheet + PBOC Balance Sheet + ECB Balance Sheet

Stocks Always Go Up...Right?Gather around....I have short story to tell
Once upon a time, in a town called Sweetville, there lived a child named Lily, whose love for cookies knew no bounds. From the moment she took her first bite, a magical spell was cast upon her taste buds, and she became powerless to resist the sweet tempt

Central Bank Balance Sheet vs NasdaqUntil the job market forces the Fed's hand, their balance sheet can keep on shrinking (letting Nasdaq to keep out performing it).
Using ratio charts (instead of overlaid data series) works as a Rosetta stone. Helps see the underlying macro economics is play.
#fed #fomc #nasdaq

🔥 Is The Bitcoin Halving Causing Bull Markets? New Theory!The classical Bitcoin theory about halvings is that they "cause" bull-markets because the supply mined gets halved, leading to a negative supply shock and therefore increasing the value per Bitcoin.
This is not a surprising theory since it makes a lot of sense and has worked in the past. But, is th

USD Liquidity vs S&P vs BTCThis cart shows how USD liquidity leads assets such as Bitcoin and stock market.

USD Liquidity vs S&P vs BTC - Liquidity Leads AssetsPlotting USD Liquidity for the past 5 years versus the S&P and Bitcoin. Made twitter-famous by Raoul Pal and Arthur Hayes. As we can see in the chart, liquidity is tightly correlated with the S&P and also drives Bitcoin cycles.
Liquidity looks to lead price movements in both assets classes.
Ques

See all ideas