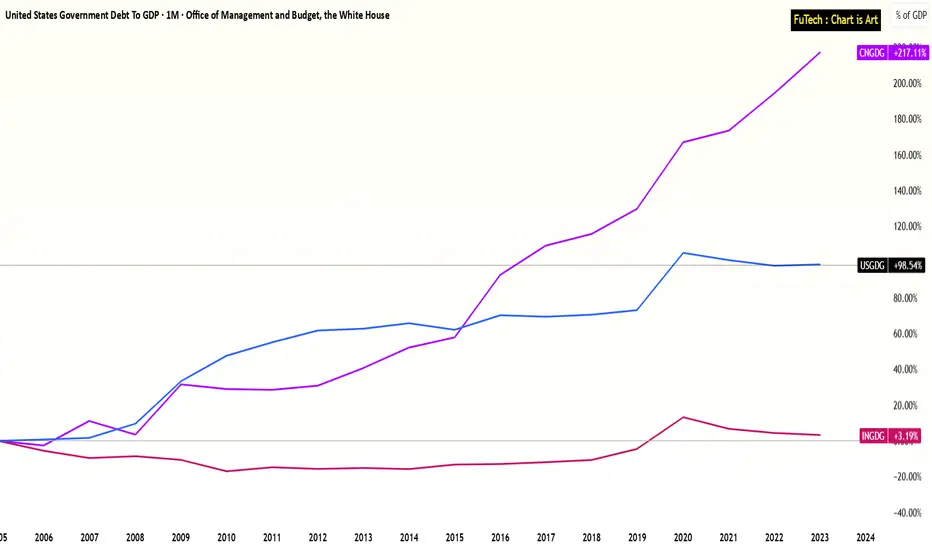
India, USA, China - Government Debt to GDP PerformanceIndia’s Fiscal Discipline Stands Out in a High-Debt Global Economy
Government Debt to GDP Performance Over the Last 20 Years:
China: +217%
USA: +99%
India: +3%
Over the last 2 decades, global economies have increasingly relied on debt to stimulate growth and manage crises.
However,
Key data points
Last release
—
Observation period
2023
Next release
—
Forecast
—
Highest
126.30 % of GDP on Dec 31, 2020
Lowest
31.80 % of GDP on Dec 31, 1981
About United States Government Debt To GDP
Generally, Government debt as a percent of GDP is used by investors to measure a country ability to make future payments on its debt, thus affecting the country borrowing costs and government bond yields.
Are You Seeing This?If being on the gold standard made the U.S. Debt-to-GDP ratio get better, then what will make the Debt-to-GDP even out now? Particularly since we're probably not going back to the gold standard. What asset can the U.S. peg the U.S. Dollar to make the Debt-to-GDP even out or decline?
Or, will the U


See all ideas
Related indicators
USAA
Asylum ApplicationsR
892.9 KPSN
USFE
Fiscal ExpenditureR
528.16 BUSD
USGBP
Budget to GDPR
−6.2% of GDP
USGBV
Government Budget ValueR
−161 BUSD
USGD
Government DebtR
36.21 TUSD
USGDG
Government Debt to GDPR
122.3% of GDP
USGR
Government RevenuesR
367.63 BUSD
USGSG
Government Spending to GDPR
34.38% of GDP
USGSP
Government SpendingR
3.98 TUSD
USME
Military ExpenditureR
997.31 BUSD