ETHEREUM trade ideas


ETH Inverse Head & Shoulders – Potential Bullish ReversalEthereum (ETH/USD) has recently formed an *inverse head and shoulders* on the 1-hour timeframe, a classic bullish reversal pattern. The left shoulder, head, and right shoulder have completed their formation, with the “neckline” roughly around the $2,400–$2,450 region. A decisive break and close above this neckline could indicate a shift in momentum favoring buyers.
From a technical perspective, the *measured move* suggests a possible climb toward the $3,000 zone. This level is derived by measuring the distance from the “head” low to the neckline, then projecting that same distance upwards from the breakout point.
Before ETH makes a full run at $3,000, price may retest the neckline area as new support. Such a pullback is normal in this kind of setup, allowing traders to confirm the breakout’s validity. If the neckline holds, it would further cement the bullish bias and provide a potential buying opportunity.
Momentum Indicators
Looking at momentum oscillators (like the Stochastic at the bottom of the chart), we see signs of *overbought* or *cooling-off* conditions, which could hint at a short-term pullback. Nevertheless, a retest of the neckline combined with a reset in momentum indicators could open the door for the next leg higher.
Key Levels to Watch
• Neckline/Support: $2,400–$2,450
• Upside Target: Around $3,000
• Potential Failure: A sustained drop below the right shoulder (around $2,300) could invalidate the bullish scenario.
Strategy
• Aggressive Entry: Consider entering on a confirmed breakout above the neckline with strong volume.
• Conservative Entry: Wait for a pullback to the neckline and look for bullish confirmation (e.g., a bullish candlestick pattern, bounce in volume) before entering.
• Risk Management: A stop-loss below the head (or below the right shoulder) can help limit downside if the pattern fails.
The inverse head and shoulders points to a bullish reversal for ETH/USD, with a potential journey toward the $3,000 zone. However, traders should remain cautious of possible retests or short-term pullbacks, particularly if momentum indicators continue to cool off. Stay vigilant, manage risk appropriately, and remember that market conditions can change rapidly.


ETHEREUM Stock Chart Fibonacci Analysis 030125Trading Idea
1) Find a FIBO slingshot
2) Check FIBO 61.80% level
3) Entry Point > 2080/61.80%
Chart time frame: D
A) 15 min(1W-3M)
B) 1 hr(3M-6M)
C) 4 hr(6M-1year)
D) 1 day(1-3years)
Stock progress: C
A) Keep rising over 61.80% resistance
B) 61.80% resistance
C) 61.80% support
D) Hit the bottom
E) Hit the top
Stocks rise as they rise from support and fall from resistance. Our goal is to find a low support point and enter. It can be referred to as buying at the pullback point. The pullback point can be found with a Fibonacci extension of 61.80%. This is a step to find entry level. 1) Find a triangle (Fibonacci Speed Fan Line) that connects the high (resistance) and low (support) points of the stock in progress, where it is continuously expressed as a Slingshot, 2) and create a Fibonacci extension level for the first rising wave from the start point of slingshot pattern.
When the current price goes over 61.80% level , that can be a good entry point, especially if the SMA 100 and 200 curves are gathered together at 61.80%, it is a very good entry point.
As a great help, tradingview provides these Fibonacci speed fan lines and extension levels with ease. So if you use the Fibonacci fan line, the extension level, and the SMA 100/200 curve well, you can find an entry point for the stock market. At least you have to enter at this low point to avoid trading failure, and if you are skilled at entering this low point, with fibonacci6180 technique, your reading skill to chart will be greatly improved.
If you want to do day trading, please set the time frame to 5 minutes or 15 minutes, and you will see many of the low point of rising stocks.
If want to prefer long term range trading, you can set the time frame to 1 hr or 1 day.


ETHUSD| BEARISH MOMENTUM PERSISTSThe price has remained stable below the 2361 resistance zone, reinforcing the continuation of the bearish trend. After an upward movement from the support zone, the price reached the 2361 level, which served as a temporary barrier. Consequently, bearish momentum is anticipated to resume, potentially leading to another attempt to breach the strong support level at 2064 also a confirmed break below this level would open the path toward the support at 1861.
However, if the price surpasses 2577, it may indicate a transition towards consolidation rather than a continuation of the downward trend.
Bearish target: 2361. 2577.
Bullish target: 2064. 1861.

Instability, BTC’s Downtrend & ETH at a Critical Level!The crypto market has been highly unstable over the past few weeks, largely due to the Federal Reserve’s stance on monetary policy. With no signs of quantitative easing, the market has reacted negatively, triggering a broader downtrend—especially for Bitcoin.
On Sunday, we witnessed a dramatic price surge, with BTC skyrocketing from $84K to $94K, only to see all gains wiped out within a single day. This price action is eerily similar to the 2019 “China Pump,” when BTC spiked from $7K to $10K before retracing completely within days. Such volatility suggests that sentiment remains fragile, and sellers continue to dominate.
Ethereum (ETH): A Sign of Weakness?
ETH isn’t looking strong either. It’s currently hovering around the $2,100 level, sitting right on a critical support zone. As I’ve highlighted in my chart, ETH has already broken below its support trendline—a bearish signal that suggests further downside risk. If this key support level fails to hold, we could see ETH drop to around $1,500 in the coming weeks.
Implications for the Altcoin Market
If ETH loses its support zone, it could trigger a major sell-off across the entire altcoin market. Historically, ETH acts as a leading indicator for altcoins, and a breakdown here could push Bitcoin dominance up to 66%-70% before altcoins find a bottom. This means we could be in for another phase of altcoin underperformance while BTC consolidates.
Final Thoughts: Watch ETH Closely!
Given the current market structure, my suggestion is to monitor ETH closely at these levels. If it fails to hold, expect a significant downward move in the altcoins market. Bitcoin dominance rising would confirm that altcoins are in for a rough period ahead. Stay cautious and trade accordingly!
Stock Market Struggles Add to Bearish Sentiment
It’s not just crypto feeling the pressure—the stock market isn’t looking good either. Both the S&P 500 and NVIDIA are down significantly today, adding to the overall negative sentiment. When traditional markets struggle, risk assets like crypto tend to follow suit.
That said, I’m expecting one final leg down before we see a shift. Once the Federal Reserve signals quantitative easing (QE), we can start anticipating a return to bullish momentum across both stocks and crypto. Until then, caution is key!

ETH in a LIVERMORE Accumulation cylinder.What is a Livermore accumulation cylinder?
The Livermore Accumulation Cylinder gained fame through the insights of Jesse Lauriston Livermore, a Massachusetts-born American investor celebrated as one of the most exceptional traders in history. His theory revolves around what is often referred to as an ascending broadening wedge, a phenomenon that unfolds over extended time frames.
What is an accumulation cylinder with a widening mouth?
First recognized by the iconic trader Jesse Livermore, who essentially laid the groundwork for technical analysis, the 'Accumulation Cylinder with Widening Mouth' is a unique and gradually developing pattern. In this scenario, the price oscillates between two diverging lines, creating a tension that can lead to a significant upward breakout.
Is Ethereum resolving its own Livermore cylinder?
This isn’t the first instance of cryptocurrency showcasing a Livermore cylinder: Ethereum might currently be in the midst of resolving its own version, and Bitcoin may have experienced a similar pattern back in 2017. While the charts may seem to align quite well, it’s crucial to remember that they are not a guarantee of future outcomes. Instead, they can serve as a valuable guide for managing risk, setting expectations, and establishing realistic profit targets. Many newcomers to crypto dream of achieving a 100x return, but as demonstrated by Bitcoin whales, true profits often come from strategically trimming and adjusting their positions, making only a few calculated moves from cycle to cycle.


Bullish bounce?Ethereum (ETH/USD) has bounced off the pivot which has been identified as a pullback support and could rise to the 1st resistance.
Pivot: 2,155.83
1st Support: 1,992.06
1st Resistance: 2,399.50
Risk Warning:
Trading Forex and CFDs carries a high level of risk to your capital and you should only trade with money you can afford to lose. Trading Forex and CFDs may not be suitable for all investors, so please ensure that you fully understand the risks involved and seek independent advice if necessary.
Disclaimer:
The above opinions given constitute general market commentary, and do not constitute the opinion or advice of IC Markets or any form of personal or investment advice.
Any opinions, news, research, analyses, prices, other information, or links to third-party sites contained on this website are provided on an "as-is" basis, are intended only to be informative, is not an advice nor a recommendation, nor research, or a record of our trading prices, or an offer of, or solicitation for a transaction in any financial instrument and thus should not be treated as such. The information provided does not involve any specific investment objectives, financial situation and needs of any specific person who may receive it. Please be aware, that past performance is not a reliable indicator of future performance and/or results. Past Performance or Forward-looking scenarios based upon the reasonable beliefs of the third-party provider are not a guarantee of future performance. Actual results may differ materially from those anticipated in forward-looking or past performance statements. IC Markets makes no representation or warranty and assumes no liability as to the accuracy or completeness of the information provided, nor any loss arising from any investment based on a recommendation, forecast or any information supplied by any third-party.

Death of ETH ?ETH is currently trading at a crucial support zone. A breakdown from this strong level could push ETH into a bearish trend, making recovery difficult.
However, if ETH manages to reverse from the $1,800–$2,000 support zone, there’s hope for a strong performance ahead. A further crash below this zone could have a severe impact on the entire Ethereum ecosystem.
The next two weeks will be critical—let’s see how things unfold. Hoping for a reversal from this support level!
Stay tuned for more updates.
Cheers,
GreenCrypto Team

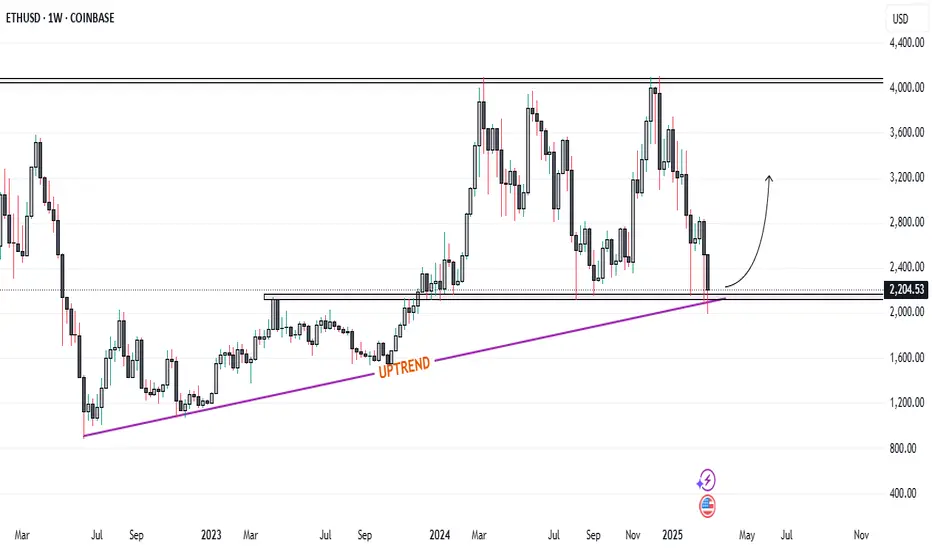
Ethereum Holds Key Support at Weekly Trendline: What's Next...?Ethereum Holds Key Support at $2,100: Could a Rally to $4,000 Be Coming? Altcoin Season and Trump’s Crypto Summit as Potential Catalysts
Ethereum is currently finding support at a critical juncture, with the price holding steady at the weekly uptrend line and an important support level around the $2,100 mark. Historically, every time Ethereum has tested this support zone, it has bounced significantly, often making strong moves toward the $4,000 level. The question now is whether history will repeat itself.
At this point, Ethereum’s ability to maintain this support level is crucial. With the market in a generally cautious state, Ethereum's resilience at this key level could signal the potential for a powerful rally in the near future. The broader crypto market is also awaiting the highly anticipated "altcoin season," where altcoins—especially Ethereum—could see a surge in demand, potentially driving prices higher.
Adding to the excitement, former U.S. President Donald Trump is set to host a crypto summit at the White House on March 7. This event could serve as a major catalyst for the next crypto rally, especially if significant regulatory or institutional insights emerge. The combination of Ethereum holding its critical support, the potential for altcoin season, and the White House summit could create the perfect storm for a significant price movement in Ethereum.
As Ethereum continues to hover around the $2,100 mark, traders and investors are closely watching for any signs of a breakout. If the rally to $4,000 materializes, it could set the stage for further gains, with the broader crypto market potentially following suit. The next few weeks could prove to be pivotal for Ethereum and the cryptocurrency space as a whole.


ETH/USD "Ethereum vs U.S Dollar" Crypto Market Heist Plan🌟Hi! Hola! Ola! Bonjour! Hallo! Marhaba!🌟
Dear Money Makers & Thieves, 🤑 💰🐱👤
Based on 🔥Thief Trading style technical and fundamental analysis🔥, here is our master plan to heist the ETH/USD "Ethereum vs U.S Dollar" Crypto market. Please adhere to the strategy I've outlined in the chart, which emphasizes long entry. Our aim is the high-risk Red Zone. Risky level, overbought market, consolidation, trend reversal, trap at the level where traders and bearish robbers are stronger. 🏆💸Book Profits wealthy and safe trade.💪🏆🎉
Entry 📈 : "The vault is wide open! Swipe the Bullish loot at any price - the heist is on!
however I advise to Place Buy stop orders above the Moving average (or) Place buy limit orders within a 15 or 30 minute timeframe most recent or swing, low or high level.
Stop Loss 🛑:
Thief SL placed at the recent / swing low level Using the 1H timeframe (2250) swing trade basis.
SL is based on your risk of the trade, lot size and how many multiple orders you have to take.
Target 🎯: 3000 (or) Escape Before the Target
🧲Scalpers, take note 👀 : only scalp on the Long side. If you have a lot of money, you can go straight away; if not, you can join swing traders and carry out the robbery plan. Use trailing SL to safeguard your money 💰.
📰🗞️Fundamental, Macro, COT, Sentimental Outlook:
ETH/USD "Ethereum vs U.S Dollar" Crypto Market is currently experiencing a bullish trend,., driven by several key factors.
Fundamental Analysis
Network Congestion: Ethereum's network congestion has decreased, with an average block time of 12 seconds.
Transaction Volume: The transaction volume for Ethereum has increased by 15% in the last 24 hours.
Mining Difficulty: The mining difficulty for Ethereum has decreased by 2% in the last adjustment.
Macro Economics
Inflation Rate: The global inflation rate is expected to decrease to 3.2% in 2025, which could lead to increased demand for cryptocurrencies like Ethereum.
Interest Rates: The US Federal Reserve has maintained its hawkish stance, keeping interest rates at 5.25% to combat inflation.
Global Trade: The ongoing trade tensions between the US and China are expected to have a minimal impact on the cryptocurrency market.
Global Market Analysis
Cryptocurrency Market: The global cryptocurrency market capitalization has increased by 2% in the last 24 hours.
Bitcoin Dominance: Bitcoin's dominance has decreased to 40.2%, which could lead to increased demand for altcoins like Ethereum.
Altcoin Market: The altcoin market has increased by 3% in the last 24 hours.
On-Chain Analysis
Transaction Count: The transaction count for Ethereum has increased by 10% in the last 24 hours.
Active Addresses: The number of active addresses for Ethereum has increased by 5% in the last 24 hours.
Hash Rate: The hash rate for Ethereum has increased by 1% in the last 24 hours.
Market Sentiment Analysis
The overall sentiment for ETH/USD is bullish, with a mix of positive and neutral predictions.
58% of client accounts are long on this market, indicating a bullish sentiment.
Positioning
The long/short ratio for ETH/USD is currently 1.4.
The open interest for ETH/USD is approximately 2.5 million contracts.
Next Trend Move
Bullish Prediction: Some analysts predict a potential bullish move, targeting $2,600 and $2,800, due to the increased demand for cryptocurrencies and the decreased mining difficulty.
Bearish Prediction: Others predict a potential bearish move, targeting $2,200 and $2,000, due to the increased competition from other altcoins and the potential decrease in global cryptocurrency demand.
Overall Summary Outlook
The overall outlook for ETH/USD is bullish, with a mix of positive and neutral predictions.
The market is expected to experience a moderate increase, with some analysts predicting a potential bullish move targeting $2,600 and $2,800.
Real-Time Market Feed
As of the current time, ETH/USD is trading at $2,400, with a 2.0% increase in the last 24 hours.
Future Prediction
Short-Term: Bullish: $2,500-$2,600, Bearish: $2,300-$2,200
Medium-Term: Bullish: $2,800-$3,000, Bearish: $2,000-$1,800
Long-Term: Bullish: $3,200-$3,500, Bearish: $1,800-$1,600
⚠️Trading Alert : News Releases and Position Management 📰 🗞️ 🚫🚏
As a reminder, news releases can have a significant impact on market prices and volatility. To minimize potential losses and protect your running positions,
we recommend the following:
Avoid taking new trades during news releases
Use trailing stop-loss orders to protect your running positions and lock in profits
💖Supporting our robbery plan will enable us to effortlessly make and steal money 💰💵 Tell your friends, Colleagues and family to follow, like, and share. Boost the strength of our robbery team. Every day in this market make money with ease by using the Thief Trading Style.🏆💪🤝❤️🎉🚀
I'll see you soon with another heist plan, so stay tuned 🤑🐱👤🤗🤩

Ethereum (ETH/USD) Key trading levels, The Week Ahead 03rd MarchEthereum (ETH/USD) remains in a bearish trend, aligned with the longer-term prevailing downtrend. The price action suggests continued selling pressure, with critical resistance and support levels defining the next move.
Key Technical Levels
Immediate Resistance: $2,490 (previous support, now acting as resistance)
Major Resistance Levels:
$2,634
$2,785
Key Support Levels:
$2,100
$2,016
$1,906
Bearish Scenario: Rejection at $2,490
If ETH fails to break above $2,490, it would confirm the resistance level’s strength.
A bearish rejection from this zone could lead to renewed selling pressure.
Downside targets include $2,100, followed by deeper support at $2,016 and $1,906 over the longer timeframe.
Bullish Alternative: Breakout Confirmation
A daily close above $2,490 would invalidate the immediate bearish outlook.
A sustained breakout could trigger an upward move toward $2,634 as the next resistance level.
A continuation of buying momentum could lead to a rally toward $2,785, reinforcing a potential shift in market sentiment.
Conclusion
ETH/USD remains bearish unless it can reclaim and hold $2,490 as support. A rejection from this level could extend the downtrend, while a breakout above resistance would signal a potential trend reversal. Traders should monitor price action closely around these levels for confirmation of the next move
This communication is for informational purposes only and should not be viewed as any form of recommendation as to a particular course of action or as investment advice. It is not intended as an offer or solicitation for the purchase or sale of any financial instrument or as an official confirmation of any transaction. Opinions, estimates and assumptions expressed herein are made as of the date of this communication and are subject to change without notice. This communication has been prepared based upon information, including market prices, data and other information, believed to be reliable; however, Trade Nation does not warrant its completeness or accuracy. All market prices and market data contained in or attached to this communication are indicative and subject to change without notice.

Ethereum Surges Nearly 10% As MVRV Ratio droppes below 1-bigger.Hello"
The ETHUSD has a strong downtrend, making it an ideal time to apply our strategies to secure profitable trades. We have an opportunity to capitalize on this trend, as it can be challenging to find favorable long trades when the trend reverses. A bearish trend line has been applied above to identify the order block. By utilizing technical analysis tools such as fear value gaps, supply zones, support areas, order blocks, and more, we were able to determine the optimal value."
It's my thought. What you think about "ETHUSD"? Write in comment below.

