ETH update#ETH in long term analysis has a very huge triangle with 5 waves like ABCDE i think this market is based on elliot waves so now we are in the 5th wave
ETHUPUSDT trade ideas

#ETH/USDT Analysis📉 CRYPTOCAP:ETH is looking weaker than CRYPTOCAP:BTC , now approaching the 4H IFVG.
⚠️ Needs to hold this level, or new lows could be on the table.
🔍 Still bearish—waiting for SMT confirmation before considering longs.
Watching closely!👀

Eth long super setupEth wasnt that bullish as it was expected to go bullish before.
three things to keep in mind.
1-Short from above level is super accurate.
2-Long is also accurate and can give you super tp.
3-Enjoy and comment your review and my accuracy

Ethereum (ETH): Broken Strong Bullish TrendEthereum is lost, where sellers are showing strong dominance near a local bullish trend, which might send the price back slightly lower for a further liquidation.
Overall we are bullish on Ethereum and we think that most of the liquidity will be switching into the Ethereum (ERC-20) network so we are going to monitor the price movement in order to find some proper zone from where we might push and see a bounce!
Swallow Team

ETH Analysis (1D)Ethereum is approaching a support level.
The risk-to-reward ratio is not very attractive since we are in a bearish trend, but we expect a reaction to the green zone.
There are two targets ahead of the price, which we have marked on the chart.
A daily candle closing below the invalidation level will invalidate this analysis
For risk management, please don't forget stop loss and capital management
Comment if you have any questions
Thank You

EthereumAlt season starts today . After the president announced the crypto reserve includes eth xrp sol Ada . this move sure places alt coins for big gains now , no one sold but they keep buying cheap , eth eill be back to 4k in no time

ETHUSDT - Buy Idea (Liquidity Seeking Condition)ETHUSDT - Buy Idea (Liquidity Seeking Condition)
Pair: ETHUSDT
Timeframe: H1 / H4
Bias: Bullish
Market Context:
Liquidity Hunt: ETHUSDT is currently in a liquidity-seeking phase, likely targeting buy-side liquidity above recent highs.
Order Flow: Price has cleared sell-side liquidity (SSL) and is now reacting from a potential discount zone.

Ethereum ($ETH) macro overviewThe previous idea showed a good working out! From the global point of view I see a hike to the area of $7300+. We continue to form the 5th Elliot wave and move to 1.618 Fibonacci level. The only coin that has not been played yet besides Bitcoin and Solana is Ethereum. If you are a conservative investor, this asset is perfect for you!
Best regards, Horban Brothers!

ETH Headed for $1,700 – Key Levels to WatchBased on the current chart, it’s clear that Ethereum is on a downward trend with a likely target of $1,700. The price is expected to gradually test critical levels such as $2,200 and $1,800 before hitting the $1,700 mark.
There’s no chance for ETH to rally toward $3,000 before retesting these lower zones. Be patient and set your limit orders in the $2,200–$1,800 range, as these levels are coming soon. Stay prepared and watch for price action in the upcoming days.

ETHUSDT Long by TeamPWRTradesTeamPWRTrades ETH Long Idea
Although the general Crypto market has been showing weakness, we are expecting Bullish movement for ETH in the next coming days. Based on Daily candles there is still a possibility of ETH heading towards it's daily support zone at 1800. Our team recommends using low leverage 1-2% of capital for this trade due to the daily volume signaling a possibility of ETH reclaiming 2500-2800 zone.
Enter
1: 2160
2: 2210
TP1: 2500
TP2: 2800
SL: 2088
Trade Active
Happy Trading,
TeamPWR

Short term rallyTriple bullish divergence on the RSI. In the 4h time frame Ethereum could go up around 10% before going down again.

ETHThis is ferocious
This is massacre
This is illegal
BUT
it is what it is
no crying in the casino
.--.
/ \
| o o |
| (_) |
\____/---__
|| |
/||\ |--+
/ || \
I'm sorry

$ETH rumor is that big banks are buying the gurus on twitter are talking about how big MEXC:ETHUSDT banks are buying ETH

ethereumthe price action of Ethereum looks good ,but i see more discount coming and i have confidence that 1400-1500 will set impulse leg a with a strong moment for new rally.
at the moment the price is seating on daily demand structure, its key to allow the weekly candle close tomorrow for new chart.

ETH/USDT – Is Momentum Heating Up?I’m spotting a bullish structure on the ETH/USDT 15-minute chart, with the price moving within an ascending channel near the $1,900 support zone. If the bullish momentum holds, I’m looking at a potential target around $2,050–$2,100, with a reasonable risk–reward ratio.
What are your thoughts? Are we headed to the moon, or do you foresee another pullback before further upside? Feel free to share your alternative scenarios and the rationale behind them. Good luck and happy trading!

ETH as well in a big opportunity as btc eth is in a big ascendant channel, where is formed a big falling wedge inside the channel, we are now on the support of the channel and of the wedge, so should be a nice level hard to let it down, there is even fib retracement to fill the gap formed, so i expect eth a nice move of 20/30% if trump doesnt say shit as every day of his life !!! trade safe and open a max leverage of 10x

ETH BREAKOUTAs i can see in a Weekly chart that the ETH has broken it's triangle pattern, and right now struggling to break its imp level 1,900 if EHT closes this week's candle under 1,900, so after retest it may show 1,200...

ETH Crazy Trade High-Risk, High-Reward Trade Confirmed! As I mentioned before, if liquidity is taken, I will enter after getting confirmation from my TradeShoots indicator on the 15-minute timeframe.
I’ve got the confirmation, and now I’m excited for this crazy trade! 🚀🔥
What do you think? Will this trade hit the target or not? 🤔 Drop your thoughts in the comments! Don’t forget to like, share, and follow for more setups! 📊🔥

Ethereum Downside to 1000!!!Ethereum has already broken the upward support trendline within the double top formation.
A break of that support line is bearish for Ethereum, especially now that it looks to complete its double top formation.
Ethereum may have a short interim bounce back to 2200 from todays levels of 1800. But will most likely fail to 1000, where that is the next support zone nearby.
Bitcoin looks like its on its way to retest its prior breakout zone of 65-70k, which would mean a 20% decline in bitcoin. If BTC were to decline 20%, this would bring a 40%+ decline in other coins including ETH. Which would indicate if BTC fell to 65k, it would solidify ETH drop to 1000.

ETH generational long opportunityETH has returned to its monthly buy setup completing its bullish retest. Expecting a turnaround in this monthly zone, possibly going for 1720ish.

Ethusdt “longs triggered. Wry is bouncing from a support and should do a quick fire.
2120 usdt is the first target
ETH:sell@1960-1980ETH's downward trend is not over yet, rising is a short-selling opportunity
ETH sell@1960-1980
tp:1920-1900
Currently, my account balance has grown from an initial $40,000 to $600,000 in profits. I will share accurate trading signals every day, and you have the option to copy my trading orders. If you're interested in getting these signals, you can click on the link below this article.

ETHEREUM ( SHORT TERM )Hello crypto community!
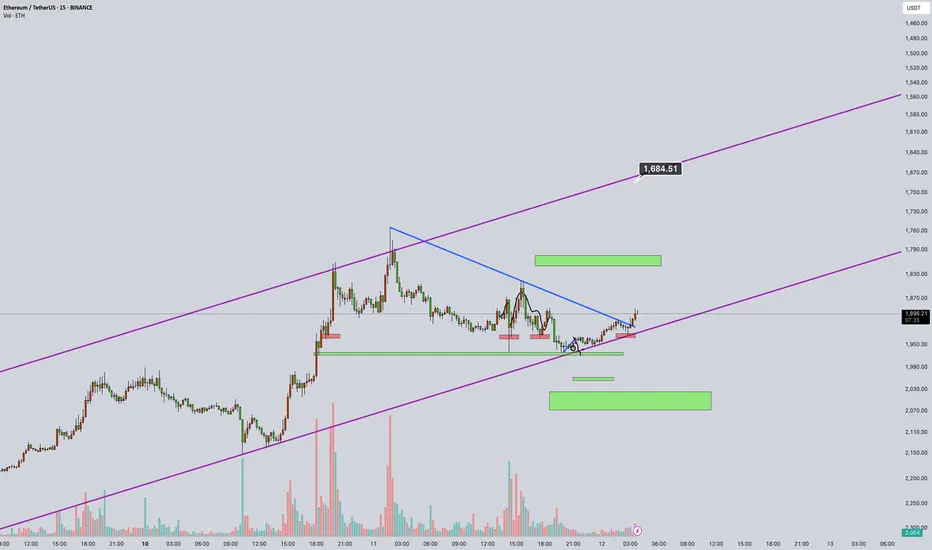
In this analysis, I’ve examined the Ethereum (ETH/USDT) 15M chart by inverting it.
It’s 12 March 2025, exactly 5 years since 12 March 2020, when Bitcoin crashed 55% in a single day, marking the “Black Thursday” that shook the market.
Now, the ETH chart shows the purple trendline as resistance (inverted to 1,684 USD) and green zones as support (inverted to 1,500-1,600 USD).
The pattern suggests a potential downturn; a break below the blue line could trigger a sharp pullback. Volume has risen by ~20% in the last hour, supporting this move.
Potential Scenario:
If resistance at 1,684 holds, the price may test support at 1,500-1,600, with a possible drop to 1,400. While not as severe as the 12 March 2020 crash, this week calls for caution. As a spot trader, I’m planning positions around the 1,600-1,500 range.
What do you think? Will ETH drop, or will the bull run continue? Share your thoughts below! 📉📈