Ethereum - Still a textbook chart!📌Ethereum ( CRYPTO:ETHUSD ) will first drop, then rally more:
🔎Analysis summary:
Over the course of the past couple of weeks, Ethereum has just been consolidating. But actually looking at the higher timeframe, Ethereum remains overall bullish. But first, we have to see another short term drop
Key facts today
Key stats
About Ethereum
Ethereum — the world’s second-most famous blockchain network — is a platform for creating decentralized applications based on blockchain and smart contract technology (a command that automatically enforces the terms of the agreement based on a given algorithm). It's the chain that birthed DeFi (decentralized finance) and started the NFT craze which saw billions of dollars pour into cryptocurrency. Safe to say, it's one of the big dogs.
Related coins

ETHUSD (3H chart pattern ).ETHUSD (3H chart pattern ).
structure-based take.
What the chart shows
Strong impulsive drop → then a bearish descending channel (flag)
Price is below the Ichimoku cloud → bearish bias
Me’ve marked a breakdown attempt near the lower channel
This looks like a bear flag continuation, not a reversal
🎯

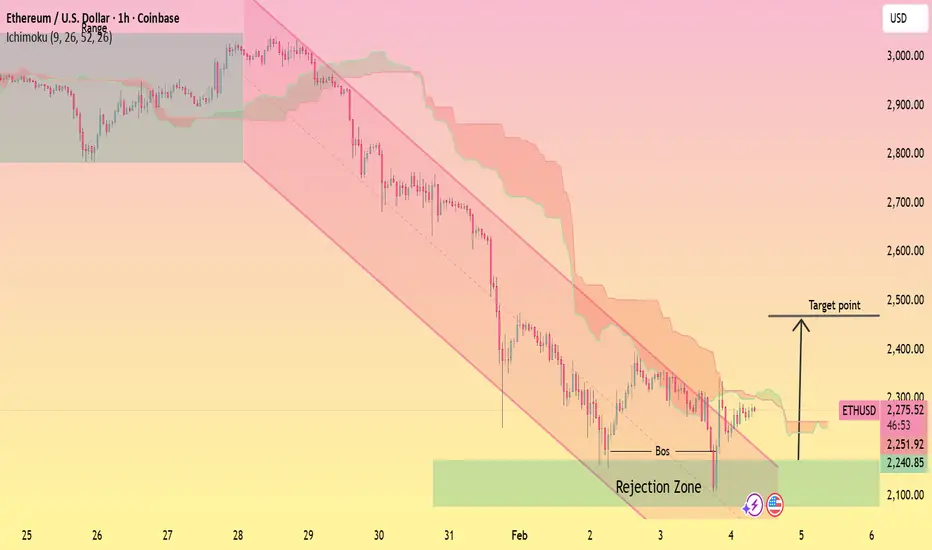
ETHUSD Downtrend Channel – Reversal Setup Toward Key ResistanceThis 1H ETHUSD chart shows Ethereum trading within a well-defined descending channel, confirming a strong bearish trend from late January into early February. Price remains below the Ichimoku cloud, keeping overall bias bearish, but a clear bounce from the highlighted demand/rejection zone has forme
ETHUSD (2H) — clear picture...ETHUSD (2H) — clear picture
Here’s the clean breakdown based on what’s on my chart.
Market Structure
Strong bearish trend
Price is below Ichimoku cloud → trend still bearish
Descending trendline holding as resistance
No bullish structure break yet
Sell Targets 🎯
From current price area (~2190–2200

ETHEREUM BULL OR BEAR? (READ CAPTION)Hi trader's what do you think about ETHEREUM
Ethereum is currently maintaining a bullish market structure, supported by strong buying interest at lower price levels. The overall trend favors buyers, and price pullbacks are considered healthy corrections within the broader uptrend.
🟢 Support Level:

Ethereum — Downside Projection📉 CRYPTO:ETHUSD has confirmed a lower‑low sequence after breaking below the November low, keeping the structure weak and favoring lower highs below 3K.
A short‑term bounce from the 61.8% Fibonacci extension area near 2K can unfold, but it is expected to remain corrective, setting the stage for f

ETHEREUM Channel Down got oversold but this isn't the bottom!Ethereum (ETHUSD) is extending its losses as, following the January 14 rejection on its 1D MA100 (green trend-line), it made a Lower High on its 4-month Channel Down that kick-started the new Bearish Leg.
The 1D RSI turned oversold (below 30.00) for the first time since November 21 2025 but besides

ETHUSD — two scenariosScenario 1:
Price may fluctuate within the 2,600–3,450 range for some time. After that, a move toward the 2,100–2,200 area becomes possible.
Scenario 2:
A direct drop into the 2,100–2,200 zone.
Since markets usually fall faster than they rise, the second scenario currently looks more likely.

ETH Breaks Support, Bearish Continuation
This is a 1-hour ETH/USD chart with Ichimoku Cloud. Price first moved sideways in a defined range, then rallied into a clear resistance zone near the top. After rejection, ETH broke down below key support and the Ichimoku cloud, confirming a bearish shift. Price is now trending lower with weak mome

ETH SHORT idea Perfect H&S PATTERN ON DTF Trade plan is mentioned
please dyor its not a buy or sell call
so always dyor before any Decision

See all ideas
Summarizing what the indicators are suggesting.
Oscillators
Neutral
SellBuy
Strong sellStrong buy
Strong sellSellNeutralBuyStrong buy
Oscillators
Neutral
SellBuy
Strong sellStrong buy
Strong sellSellNeutralBuyStrong buy
Summary
Neutral
SellBuy
Strong sellStrong buy
Strong sellSellNeutralBuyStrong buy
Summary
Neutral
SellBuy
Strong sellStrong buy
Strong sellSellNeutralBuyStrong buy
Summary
Neutral
SellBuy
Strong sellStrong buy
Strong sellSellNeutralBuyStrong buy
Moving Averages
Neutral
SellBuy
Strong sellStrong buy
Strong sellSellNeutralBuyStrong buy
Moving Averages
Neutral
SellBuy
Strong sellStrong buy
Strong sellSellNeutralBuyStrong buy
Displays a symbol's price movements over previous years to identify recurring trends.
Discover funds exposed to Ethereum and find the best way to access the coin.
Frequently Asked Questions
The current price of Ethereum (ETH) is 1,918.5 USD — it has risen 0.29% in the past 24 hours. Try placing this info into the context by checking out what coins are also gaining and losing at the moment and seeing ETH price chart.
The current market capitalization of Ethereum (ETH) is 231.55 B USD. To see this number in a context check out our list of crypto coins ranked by their market caps or see crypto market cap charts.
Ethereum (ETH) trading volume in 24 hours is 44.69 B USD. See how often other coins are traded in this list.
Ethereum price has fallen by −28.52% over the last week, its month performance shows a −33.36% decrease, and as for the last year, Ethereum has decreased by −29.76%. See more dynamics on ETH price chart.
Keep track of coins' changes with our Crypto Coins Heatmap.
Keep track of coins' changes with our Crypto Coins Heatmap.
Ethereum (ETH) reached its highest price on Aug 24, 2025 — it amounted to 4,955.3 USD. Find more insights on the ETH price chart.
See the list of crypto gainers and choose what best fits your strategy.
See the list of crypto gainers and choose what best fits your strategy.
Ethereum (ETH) reached the lowest price of 0.4 USD on Oct 22, 2015. View more Ethereum dynamics on the price chart.
See the list of crypto losers to find unexpected opportunities.
See the list of crypto losers to find unexpected opportunities.
The current circulating supply of Ethereum (ETH) is 120.69 M USD. To get a wider picture you can check out our list of coins with the highest circulating supply, as well as the ones with the lowest number of tokens in circulation.
The safest choice when buying ETH is to go to a well-known crypto exchange. Some of the popular names are Binance, Coinbase, Kraken. But you'll have to find a reliable broker and create an account first. You can trade ETH right from TradingView charts — just choose a broker and connect to your account.
Crypto markets are famous for their volatility, so one should study all the available stats before adding crypto assets to their portfolio. Very often it's technical analysis that comes in handy. We prepared technical ratings for Ethereum (ETH): today its technical analysis shows the strong sell signal, and according to the 1 week rating ETH shows the strong sell signal. And you'd better dig deeper and study 1 month rating too — it's sell. Find inspiration in Ethereum trading ideas and keep track of what's moving crypto markets with our crypto news feed.
Ethereum (ETH) is just as reliable as any other crypto asset — this corner of the world market is highly volatile. Today, for instance, Ethereum is estimated as 13.46% volatile. The only thing it means is that you must prepare and examine all available information before making a decision. And if you're not sure about Ethereum, you can find more inspiration in our curated watchlists.
You can discuss Ethereum (ETH) with other users in our public chats, Minds or in the comments to Ideas.