This is ready to explode
How high can this go?
(IMO, Target = $ 10k)
Wave degree:
Primary: Wave 5 (larger degree),
Intermediate: Wave 3,
minor: Wave 3 (Impulsive rally),
ETHUSDT.P trade ideas

ETH - UpdateOur box didn't hold, we swept the previous low and are currently grinding down again.
The market is looking horrendous overall: we have 2 big spot buying twaps going on on BTC, while price keeps grinding down. Obviously that takes the entire market down as well, so it's impossible for ETH to catch a decent bid here.
Since it seems to react well off EMAs recently, I used these to give a general outlook about where we are and what 'working ranges' we might expect going forward.
I'm slowly positioning long on ETH through longer dated calls (from end of July through end of year). The expectation is to DCA in here and sell a big portion on the first big IV spike.
You can expect IV to go up into the event and come down after, so since I'm banking on IV to offset time decay and not really hoping on significantly higher prices, I need to be out before the actual event, because it reduces uncertainty and therefor should decrease implied volatility (IV), which has a big impact on options pricing.


Ethereum still at the edge
Ethereum almost got to the target zone I've marked 6 days ago. Missed by 21 dollar. But I'm yet cautious about bullish entries. Last 12H closed bearish, so I believe this chart will require another day or two to draw some certainty. Till then we may expect dips under 3427 and possibly to that zone I've marked as well.
Level at 3650 remains decisive for mid term direction. ETH got to find acceptance above it to go for new ATH.

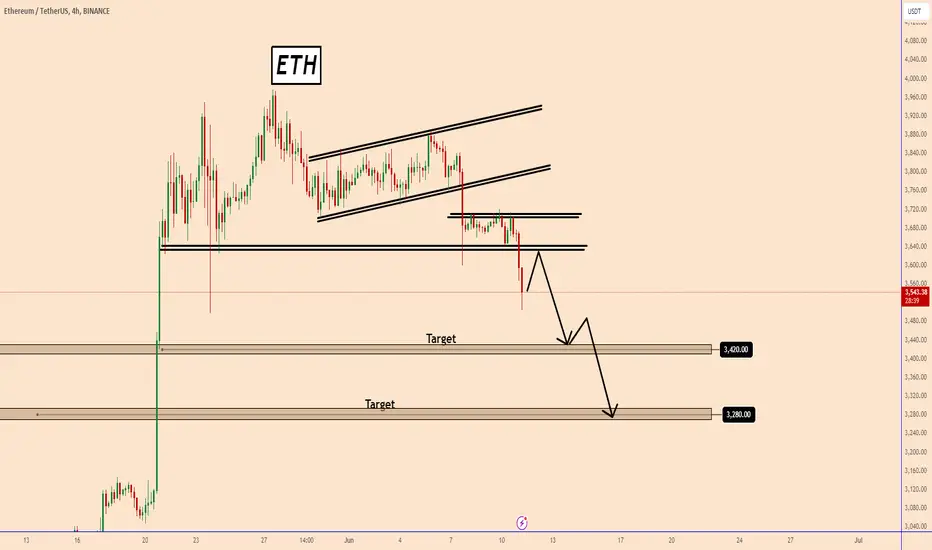
ETH Bearish Breakout: A Confirmation to Further Declines?ETH Bearish Breakout: A Confirmation to Further Declines?
Ethereum has recently emerged from a bearish pattern, signaling an increased likelihood of an extended downward trend. The initial pattern that triggered the bearish momentum began on June 7th. Following this, we observed another significant bearish wave as the price breached yet another structure zone yesterday.
This breakout has heightened the probability that Ethereum (ETH) may retest the 3420 level. Should this bearish pressure persist, there’s a potential for the price to descend further, possibly reaching as low as 3280.
You may find more details in the chart!
Thank you and Good Luck!
❤️PS: Please support with a like or comment if you find this analysis useful for your trading day❤️
#ETHUSDT: First correction and then targeting $4500! Dear Traders,
Hope you are doing great, our previous analysis on ETH, where we had pointed out of potential reversal in price action. Price had created AB=CD pattern and after completion price moved as we had expected. However, due to extreme bullish buy volume that emerged in the market, price left fair value gap. We anticipating price to drop to the region to fill the area and continue the bullish momentum towards $4450.
**If you like our work please like and comment, follow for more**
Team SetupsFx_

ETH - Long Idea + Future OutlookETH
Has some headline tailwinds so gonna be very picky about shorting this one going forward, except after news candles. No need to discuss whether ETF thing is bullish or not, it's more about not being stopped in the wick up caused by some Bloomberg fella's tweet; I'd rather enter there.
Longs are in the white box for me.
Again: bullish or not, I will simply not long something that's up +5% and is now putting a bunch of weekend longers underwater. (Price came down a bit while typing this, prices are more attractive here)
Sweep recent low and you technically have a div setup into D1 EMA 100.
I don't know if you really want that to happen if you're bullish on this though, but iirc ETH has done similar shenanigans in the past.
Lose that EMA and we're looking at the diagonal. Lose that and we're looking at hamster races for the next year or 2-3.
glhf
H&M

ETH - Retest 3400$Think we will see a retest of ~3.4k coming days. I am aware thas most people probably think it won't happen, it's too low, ETF bla bla, but I just ignore everything almost all the time and just look at the charts :)
I have traded the breakout from 3k to 3.6k and I'm flat currently but I think ETH is clearly not done yet but I won't buy at current prices.
Stay safe!

Ethereum (ETH): 2 Fakeout Moves = Potential Breakdown MovementEthereum has been struggling to breakout from the local resistance zone, where the price has formed a nice two-fakeout zone, which can also be seen as a double-top pattern.
Now that we are looking for further movement below that resistance zone, we will be keeping an eye on the neckline zone, which we will touch once we see a full breakdown from that resistance zone!
Swallow Team

Ethereum in Daily Timeframe.The Ethereum daily timeframe chart shows significant technical levels. The local high is approximately $4,093, with a downward-trending resistance line indicating a bearish trend from this peak.
The initial support is around the $3,440 level, represented by a yellow dotted line. The main support is identified by a white upward trend line at $3,100.
Ethereum is currently trading around the $3,500 level. A break below this level could lead to further declines.
POV: ETH must hold the current support level; if not, be prepared for an 11% drop.
Do your own research before investing.
Regards
Team Dexter.

#ETH correction phase may be over📊#ETH correction phase may be over✔️
🧠From a structural perspective, we have successfully broken out of the downtrend line. If a bullish head and shoulders structure can be constructed near the buying zone, then there is a high probability that we will use this bullish structure as support to start rising, and we will have the opportunity to challenge the previous high. 📈
➡️In addition, breaking through the downward trend line is a positive signal for us, but the appearance of such a signal does not allow you to directly chase the rise. It is unreasonable for you to chase the rise without fully understanding my point of view.
🔥Although there are positive signals, we made a short trade in the resistance zone and have now locked in the main profit. Congratulations to the friends who followed Wolf King to print money. 💰🍻
🤜If you like my analysis, please like 💖and share it💬
💕 Follow me so you don't miss out on any signals and analyze 💯
BINANCE:ETHUSDT.P

#ETH head and shoulders structure is not established📊#ETH head and shoulders structure is not established❌
🧠Although we broke through the downward trend line, we still chose to fall in the end. The expectation of the bullish head and shoulders structure also failed, so the long orders we made based on this expectation were triggered to stop loss. Although it has fallen below the low again, we are currently in the buying zone. I will not chase shorts in this zone. Even if I want to go short, I have to wait for a rebound to occur before considering it.
➡️If we continue to fall, then we can just wait in the support area below. ☕️
Let’s see 👀
⚠️Don’t forget risk management⚠️
✔️Trade Security✔️
🤜If you like my analysis, please like 💖 and share 💬
💕 Follow me so you don't miss out on any signals and analyze 💯
BINANCE:ETHUSDT.P

ETH [ BEARISH SWEET ZONE]We are expecting a massive drop of ETH , however this T.A time frame view is 1D do not expect that it will play as early , it will take time ; rest assured that if you are going to put a position manage strictly your risk reward ratio ; it may play out but it will grab some Liquidities before it will play out

ETHEREUM TO 18.000 USD#ETH looks like ready to repeat channel pattern like in every previous cycle.
But first let's if DB will work here.
If so we should get only higher lows from here and start parabolic run after breaking 4.000 USD.

ETH setup in the choppy marketlet us see where the ETH will go in this choppy market. to the moon or to the bone? wish me luck!

ETHUSDT.1DIn this technical analysis of the Ethereum (ETH)/USDT daily chart on Binance, we are reviewing the primary technical indicators and price structures that might influence Ethereum's price movements in the near future.
Price Action and Support/Resistance Levels
The current price of ETH is approximately $3,042.48, showing a recent decline of about 1.93%. The chart identifies critical resistance (R1, R2, R3) and support levels (S1, S2, S3). The highest recent resistance is at $4,371.66, and support levels are situated at $3,293.19, $2,874.64, and $2,112.62. These levels are instrumental in determining potential turning points or consolidation zones in the market.
Technical Indicators
MACD (Moving Average Convergence Divergence): The MACD line below the signal line and a negative histogram suggest a bearish momentum is currently prevailing. The decreasing histogram height also indicates that the bearish momentum may be losing strength, which could mean a potential stabilization or reversal of the price movement soon.
RSI (Relative Strength Index): The RSI stands at approximately 55, indicating a neutral market condition. This level suggests that while the market is not in overbought or oversold territory, there is still room for either bullish or bearish developments depending on broader market cues.
Chart Patterns
The chart shows Ethereum in a descending channel pattern, indicating a potential continuation of the bearish trend if the upper boundary of the channel holds as resistance. The next key observation will be whether the price tests and respects the S1 support level, which could lead to a rebound towards R1.
Conclusion
Considering the present indicators and the price behavior within the descending channel, Ethereum appears to be navigating a bearish phase with the potential for testing further support levels, particularly if the current support at S1 fails to hold. The bearish MACD suggests caution, but the neutral RSI provides a slight buffer, indicating that not all bullish momentum is lost. Traders should watch for potential rebounds at major support levels or a break above the channel as signals for a trend reversal. As with any trading strategy in such volatile markets, setting stop losses and monitoring key resistance and support flips are advisable to manage risks effectively.

Playing at a HVAHello traders,
I'm well aware that this long is still higher in risk. Just because we didn't take out the lows with full price-action.
However, the positioning is good and I'm playing the continuation. I can take the risk and otherwise I'll look for a re-entry.

ETHUSDT IDEAHello Traders Hope You Are Enjoying Our Analysis. Today We Will Discuss About ETH
(Update)
Formed Ascending Triangle On WEEKLY Chart☑️
In Case Of Successful Breakout Wait For Massive Bullish Wave✍️

ETH wait for 3000 for buy/longCMP the price at eth is going side ways incase the price starts making lower low and lower high on daily time frame, then follow the structure and wait for change of trend at the zone of 3000 where we have a order block and we can if we see impulsive move towards it will be target for 4250

"Expert Tips for Selling Ethereum (ETH): Maximize Your Profits!"Topics Covered:
Understanding Market Trends
Timing Your Ethereum Sales
Risk Management Techniques
Maximizing Profits with Smart Trading Strategies

#ETH: eyeing a potential breakout on the 4-hour timeframe!Hey everyone!
If you're enjoying this analysis, a thumbs up and follow would be greatly appreciated!
ETH is currently trading within a falling wedge pattern, which can be a bullish reversal signal. There's support around $3420-$3480, which could act as a springboard for a price increase.
Here's what we're watching:
Breakout confirmation: A clean break and close above the upper trendline of the wedge is crucial for a potential trend reversal.
Upside potential: If the breakout is confirmed, we could see a significant price increase.
Invalidation:- 4hr candle close below $3400 level.
Let me know your thoughts in the comments below!

Lingrid | ETHUSDT double BOTTOM. Long Despite the overall uptrend on the daily timeframes, the 4H chart shows a more mixed picture, with the market moving sideways. However, a closer look at BINANCE:ETHUSDT price action reveals a more promising development. The price has formed a double bottom pattern, reaching the support level that was tested before. This has created a new range zone that breakout of it may lead to new highs. Given this setup, I expect the price to make an upward move and retest swap zone. My target is the resistance zone at 3700
Traders, if you liked this idea or if you have your own opinion about it, write in the comments. I will be glad 👩💻

Is Ethereum Redirecting?📊 According to the buying pressure in the market, if the range of 3600 units is broken upwards and the price stabilizes above it, the price may increase to the range of 3680 units🎯, and in the case of the strength of the range of 3820 units🎯🎯.
📊 Otherwise, the price may drop to the range of 3400 units.
