EURUSDTMSP trade ideas

EURUSD - Buyers are increasing Price is going to break its bearish channel. Price has a good demand level and reacted to it. Good area for taking a long position.
Trade safe

EURUSD - 15m Sell ScalpThe EURUSD pair is displaying bearish momentum as it consolidates beneath the recent support level, which has now turned into resistance. This pattern indicates that the pair is likely to continue its downward trajectory. The current consolidation phase under the broken support zone suggests a potential move towards the previous spike breakeven area. Traders should monitor this level closely for signs of further decline or potential pullbacks.

EURUSD: We are waiting for a breakHello traders,
The bearish channel is obvious in the chart! you can see that upward moves are weak but the downwards are so strong. I consider the trend to be bearish. However, while my total bias over the pair is still bearish I think any breaks over the zone might lead the price to reach the next strong zone which is around 1.0790
At the same time breaking the bullish yellow trend line down and the zone would alter our bearish scenario. Can't wait to the results.
Have fun and enjoy your life.

EURUSD- Bearish TrendThe pair continue to go down as the bulls have shown little interest but in vain. After printing a bullish diveregnce bulls took some charge but could'nt get pass the down trend fib level of 0.5. After the faliure the pair has currently restest the area again but failed and formed inverted hammer candle near the bearish trendline. All these bearish confluence indicate the bearish cycle will continue.

EURUSD 4HBased on the previous support and resistance of the EURUSD this is a possibility for the next week this is not exact numbers this is just my take on the market.

CHART BREAKDOWN EURUSD: Key Levels, Targets and Thoughts!Brief Description🖊️:
The chart provides insights into critical market levels, emphasizing an essential demand zone (low-risk buy zone) spanning from 1.0653 to 1.0662. Additionally, a low-risk sell zone between 1.0887 to 1.0897, respectively, is highlighted.
Things I Have Seen👀:
Important Supply Zone🟢: Identified between 1.0887 to 1.0897, serving as a low-risk sell.
Important Demand Zone🟢: Identified between 1.0653 to 1.0662, serving as a low-risk buy.
Bullish Targets📈:
1.0720: Possible retracement area.
1.0730: Possible retracement area.
1.0760: Possible retracement area.
1.0810: Possible retracement area.
1.0840: Possible retracement area.
1.0887: Significant supply zone.
1.0910: Liquidity area.
Bearish Targets📉:
1.0840: Possible retracement area.
1.0810: Possible retracement area.
1.0760: Possible retracement area.
1.0730: Possible retracement area.
1.0720: Possible retracement area.
1.0662: Essential Demand Zone
Ultimate Target: 1.0650- Laying Low Liquidity
What's Important Now❗
Currently, the crucial approach is to wait and observe the price action at this level. We need to assess how the market reacts before considering any decisive moves. Stay observant and responsive to real-time developments in the market.
Market Analysis: EUR/USD Struggles To RecoverMarket Analysis: EUR/USD Struggles To Recover
EUR/USD is attempting a recovery wave from the 1.0675 zone.
Important Takeaways for EUR/USD Analysis Today
- The Euro declined toward 1.0675 before it started a recovery wave against the US Dollar.
- There is a key bullish trend line forming with support at 1.0710 on the hourly chart of EUR/USD at FXOpen.
EUR/USD Technical Analysis
On the hourly chart of EUR/USD at FXOpen, the pair extended the decline below the 1.0720 support zone. The Euro even declined below 1.0700 before the bulls appeared against the US Dollar, as mentioned in the previous analysis.
The pair tested the 1.0675 zone and recently started a recovery wave. There was a move above the 1.0710 resistance zone, but the bears were active near 1.0745. As a result, there was another pullback to 1.0690 and the pair is now consolidating below the 50-hour simple moving average.
Immediate resistance on the EUR/USD chart is near the 1.0718 zone. It is close to the 50% Fib retracement level of the downward move from the 1.0744 swing high to the 1.0690 low.
The first major resistance is near the 1.0725 level or the 61.8% Fib retracement level of the downward move from the 1.0744 swing high to the 1.0690 low. An upside break above the 1.0725 level might send the pair toward the 1.0745 resistance.
The next major resistance is near the 1.0780 level. Any more gains might open the doors for a move toward the 1.0820 level. Immediate support on the downside sits at 1.0710.
There is also a key bullish trend line forming with support at 1.0710. The next major support is the 1.0695 zone. A downside break below the 1.0695 support could send the pair toward the 1.0675 level. Any more losses might send the pair to 1.0650.
Trade over 50 forex markets 24 hours a day with FXOpen. Take advantage of low commissions, deep liquidity, and spreads from 0.0 pips. Open your FXOpen account now or learn more about trading forex with FXOpen.
This article represents the opinion of the Companies operating under the FXOpen brand only. It is not to be construed as an offer, solicitation, or recommendation with respect to products and services provided by the Companies operating under the FXOpen brand, nor is it to be considered financial advice.

best time to buy??the best time to buy is at 3rd entry, because the size between entry level and cut loss level is just very small risk. i can see the uptrend behavior from uptrend trendline that i drawn.. so what ever it is TRADE AT YOUR OWN RISK

Bearish drop?The Fiber (EUR/USD) is currently at the pivot which has been identified as an overlap resistance and could fall to the pullback support.
Pivot: 1.0737
1st Support: 1.0685
1st Resistance: 1.0770
Risk Warning:
Trading Forex and CFDs carries a high level of risk to your capital and you should only trade with money you can afford to lose. Trading Forex and CFDs may not be suitable for all investors, so please ensure that you fully understand the risks involved and seek independent advice if necessary.
Disclaimer:
The above opinions given constitute general market commentary, and do not constitute the opinion or advice of IC Markets or any form of personal or investment advice.
Any opinions, news, research, analyses, prices, other information, or links to third-party sites contained on this website are provided on an "as-is" basis, are intended only to be informative, is not an advice nor a recommendation, nor research, or a record of our trading prices, or an offer of, or solicitation for a transaction in any financial instrument and thus should not be treated as such. The information provided does not involve any specific investment objectives, financial situation and needs of any specific person who may receive it. Please be aware, that past performance is not a reliable indicator of future performance and/or results. Past Performance or Forward-looking scenarios based upon the reasonable beliefs of the third-party provider are not a guarantee of future performance. Actual results may differ materially from those anticipated in forward-looking or past performance statements. IC Markets makes no representation or warranty and assumes no liability as to the accuracy or completeness of the information provided, nor any loss arising from any investment based on a recommendation, forecast or any information supplied by any third-party.

Lingrid | EURUSD shift in the TREND. Downward MOMENTUM continuesThe price perfectly fulfilled my last idea. It literally tanked hit the target zone. FX:EURUSD is currently forming a double bottom pattern after its recent channel breakout. On the 1H timeframe, the market has been trading sideways since the Asian session, suggesting a potential pause in the bearish momentum. Given that the markets often consolidate after significant moves, I expect the EUR to continue moving sideways for now. However, if the price pulls back to the resistance zone around 1.07400-1.07600, I anticipate a bearish trend continuation from this level. My goal is the support level of around 1.06600
Traders, if you like this idea or have your own opinion on this matter, write in the comments. I will be glad 👩💻

Its destined for the dump small pullback and down we goWe are going down IFVG and OB are resistance levels.
Always follow these rules
- Accumulation / Manipulation / Distribution
- No liquidity raid = No trade
- Never buy high and never sell low
“Adapt what is useful, reject what is useless, and add what is specifically your own.”
Dave FX Hunter ⚔

!!!!!! EURUSD UNIQUE IDEA !!!!!!!#EURUSD
UPDATE
EURUSD is making the falling wedge pattern. Already getting a good volume. Ready for breakout. After this breakout we can see gain upto 100Pips+. Keep in touch we will update further soon

EUR/USD Faces Challenges Below 1.0700 - Double BottomEarly Friday, the EUR/USD pair struggles to maintain its footing, trading below the 1.0700 mark after a negative close on Thursday. The current price action hints at a potential double bottom at the 78.6% Fibonacci retracement level within a significant support zone.
Thursday's risk-averse market sentiment boosted the US Dollar (USD), keeping EUR/USD under pressure.
On Friday, disappointing PMI data from Germany and the Eurozone added to the Euro's woes. The HCOB Composite PMI for Germany fell to 50.6 in June from 52.4 in May, and the Eurozone's HCOB Composite PMI dropped to 50.8 from 52.2. Both figures missed analysts' expectations, reflecting a slowdown in private sector business activity.
Despite these challenges, our technical analysis highlights a potential opportunity. The price's reaction to the key support area suggests a possible rebound, making this an attractive zone for a long position.

EURO - Price can break support level and continue to declineHi guys, this is my overview for EURUSD, feel free to check it and write your feedback in comments👊
Some time ago price entered to flat, where it in a short time declined to $1.0810 level, after which bounced up.
Then price corrected $1.0810 level again and then rose almost to top part of flat, but then it started to fall.
Euro in a short time declined lower than $1.0810 level, breaking it and also exiting from flat, after which continued to decline.
Price at once rose to resistance line, after which it quickly fell to support level, which coincided with support area.
Next, EUR tried to grow but failed and fell back to $1.0690 level, where at the moment continues to trades near.
In my mind, price can make small movement up and then break support level and fall to $1.0600
If this post is useful to you, you can support me with like/boost and advice in comments❤️

EUR/USD Outlook ICT Concepts💰 Welcome to Your Channel!
Welcome to our channel where we delve into the intricacies of financial markets. Today, we focus on EUR/USD , dissecting its current price action to uncover strategic trading opportunities. Join us as we analyze key levels and market dynamics, aiming to refine our trading strategies and maximize potential gains.
📈 Anticipated Price Retracement
In our previous EUR analysis, we projected a price retracement to mitigate inefficiencies, including Gaps and Fair Value Gaps ( FVG ). This forecast materialized, with a notable reaction at the FVG created post-Market Structure Shift ( MSS ).
📉 Expansion and Sell-Side Liquidity
Subsequently, the price extended lower, targeting and absorbing the sell-side liquidity ( SSL ). Our analysis had delineated Optimal Trade Entry ( OTE ) levels, which the price action respected, exemplifying an optimal scenario.
🔄 Reaction to Fair Value Gap
Presently, the price has retraced to the delineated FVG, exhibiting a significant reaction at the 50% (CE) level of the FVG . This movement also induced a Smart Money Technique ( SMT ) divergence with GBP/USD .
🧠 Understanding Smart Money Technique (SMT)
You may inquire about SMT: in this context, SMT manifests when EUR registers a high, fails to achieve a higher high, and instead forms a lower high, whereas GBP/USD attains a higher high. This divergence signifies a bearish SMT , particularly when aligned with existing inefficiencies (FVG).
🔍 Outlook: Bearish or Bullish?
To consider a bullish scenario, the price must invalidate the SMT. Should the SMT persist, our stance remains bearish until pivotal levels, such as the Previous Week Low ( PWL ), are achieved.
🙏 Thank you for joining us!
Exploring EUR/USD today highlighted the importance of effective risk management in trading success. Prioritize research, implement robust strategies, and seek guidance for confident market navigation. Stay tuned for more insights on our channel. Here's to profitable trading and continuous learning!
⚠️ Disclaimer
The information provided here is for educational purposes only and should not be taken as financial advice. Always conduct your own research and consult a licensed financial advisor before making any investment decisions.

EUR/USD BUYThe EUR/USD exchange rate is influenced by several key factors, including economic performance, monetary policies, and geopolitical events. Based on recent forecasts and analyses, here’s a comprehensive outlook for the EUR/USD in 2024:
1. Monetary Policy Divergence: The Federal Reserve is expected to start cutting interest rates in 2024, with projections suggesting a reduction from the current 5.25-5.50% range to around 3.75-4.00% by the end of the year. In contrast, the European Central Bank (ECB) is anticipated to begin rate cuts later, possibly in the second half of 2024. This divergence could provide some support for the euro against the dollar .
2. Economic Performance: The U.S. economy shows relatively stronger performance compared to the Eurozone. U.S. services PMI remains above 50, indicating expansion, while the Eurozone’s manufacturing and services PMIs are below 50, indicating contraction. This disparity might limit the euro’s gains against the dollar despite potential Fed rate cuts .
3. Geopolitical Risks: Geopolitical tensions, particularly in Europe due to the Russia-Ukraine conflict, continue to pose risks. These could negatively impact the Eurozone’s economic stability and put downward pressure on the euro. Conversely, any significant de-escalation could bolster the euro .
4. Market Sentiment and Technical Analysis: Sentiment remains somewhat bearish for the U.S. dollar due to expected Fed rate cuts. However, the EUR/USD pair has shown resilience, maintaining support levels and potentially targeting higher resistance levels if bullish trends prevail. Technical analysis suggests the euro could test highs around 1.15 if market conditions favor risk assets .
5. Energy Prices: The Eurozone’s reliance on energy imports means that fluctuations in energy prices could significantly impact the euro. Rising energy costs could weaken the euro by affecting the Eurozone’s balance of payments and economic growth .
In summary, while there are bullish scenarios where the EUR/USD could reach as high as 1.15 or beyond, significant risks remain that could cap gains or even push the pair lower. These include ongoing geopolitical tensions, economic underperformance in the Eurozone, and shifts in monetary policy expectations. Analysts suggest a range of outcomes, from moderate gains to potential declines back towards parity, depending on how these factors evolve over the year .

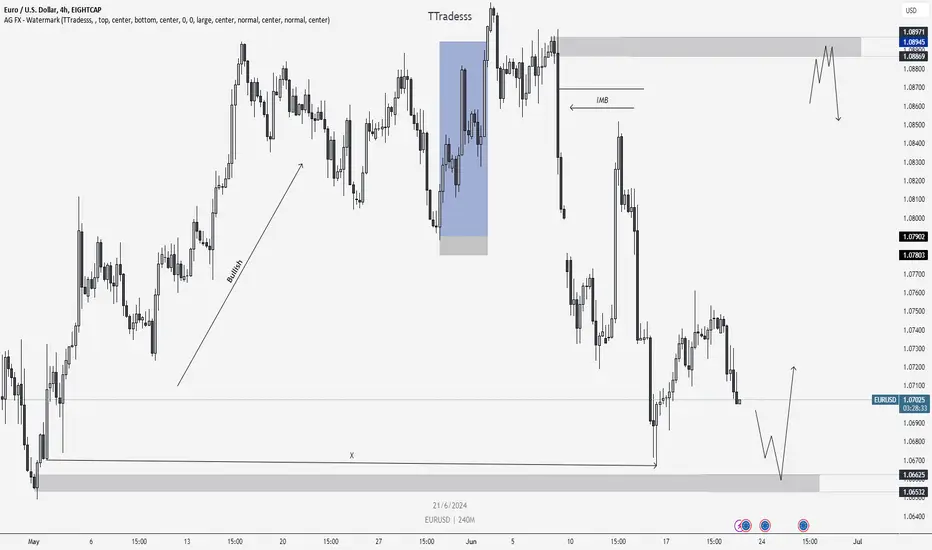
EURUSD: Weekly overview and opportunities
Reasons to Long:
Bearish long-term channel
Last break was bearish
Reasons to Short:
Near a demand zone that coincides with the bottom of the channel, which is around 1.0620
It seems that a weak short-term zone appeared around 1.0680
Conclusion:
I predict a slightly bullish week. However, I'll wait to reach mid-term zones that can be found between 1.0760 and 1.0720 to short the pair. I don't recommend taking long trades here unless you are a scalper or an extremely short-term trader.

EURUSD - UniverseMetta - Analysis#EURUSD - UniverseMetta - Analysis
D1 - Work in the 5th wave - continuation of the movement from the previous analysis. Now a 3 wave structure is being formed to continue the movement. You can limit yourself to a short stop at the level of breaking through the local second wave
To cancel, form the 3rd wave in the opposite direction.
Target: 1.06522 - 1.06298 - 1.05935

EURUSD ( 4H )EURUSD
HELLO TRADERS
YESTERDAY , as mentioned the price is under short pressure and dropping + 60 pip , aimed first target , so know see trade above turning level until stable this level rising to resistance level , if breaking this level continues a dropping .
Tendency the price is a bullish pressure in1.068
TURNING LEVEL : the price turning level at 1.068, price stable below this level it becomes reach a support level , but if breaking this level active bullish area , to reach a resistance level
RESISTANCE LEVEL: if the price trade above turning level at 1.068 , the price will rise to1.074 and 1.079 , stable this level will be reach 1,084
SUPPORT LEVEL : the price breaking turning level 1.068 , it will reach the support level of 1.058 and 1.052
CORRECTIVE LEVEL : price will 1.068 , correct itself before falling
------------------------------
* Thank you , if you support this idea with your likes and comments , I hope you a profitable day🤍🤍🤍🤍🤍

EURUSD 1W - Weekly TimeframeAfter a shift to a bearish context, we saw a strong reaction aiming to cover the fractal liquidity above. This was followed by a continuation of the bearish order flow. The targets are marked on the chart below. The invalidation of this scenario would be a price close above 1.09.
Stay tuned for more detailed analysis throughout the week.

EURUSD READY TO RISE OR SHOULD WE VISIT LOWER AREAS?In previous analyzes we took the various shorts made in recent weeks and with the last missed pending operation I mentioned that from then on I would focus only on buy operations, so here I am!
We are testing the latest support right now, maybe creating a double bottom? if so it could be a good starting point for a long.
At the same time I see a TVC:DXY that is still very strong, which despite the negative news is continuing to rise, but the rate cut could get closer and before that it could visit the highs at 106.40 which would bring the euro to the 1.6000 zone which I think is excellent to buy.
So I leave you with two setups: the first is riskier on a structure that has yet to be completed, while the second is slightly safer.
Be careful, happy trading everyone.

Professional trading advice, may be helpful to you!Hello, everyone
TODAY , the price continues under bearish zone , after breaking a support trendline
the Tendency the price is a bearish pressure in1.074
TURNING LEVEL : the price turning level at 1.074, price stable below this level it becomes reach a support level, but if breaking this level active bullish area , to reach a resistance level
RESISTANCE LEVEL: if the price braking turning level at 1.074, the price will rise to1.079 and 1.084, If the price braking turning level at 1.074, the price will rise to1.079 and 1.084, stable this level will be reach 1,089
SUPPORT LEVEL : the price trade below turning level 1.074, it will reach the support level of 1.068 and 1.063, The price trade below turning level 1.074, it will reach the support level of 1.068 and 1.063, stable this level reach to 1.058
CORRECTIVE LEVEL: price will 1.074, correct itself before falling
