KOG - DAXDAX:
Let’s have a quick look at DAX and apply the red boxes to the 4H Chart. We have our bullish above indication which if supported, should give us a move into the 23,400 region initially. That’s the level that will need to break to go higher with our ideal target level being above at the 24,6-700 region before a potential RIP.
Please do support us by hitting the like button, leaving a comment, and giving us a follow. We’ve been doing this for a long time now providing traders with in-depth free analysis on Gold, so your likes and comments are very much appreciated.
As always, trade safe.
KOG
GER40 trade ideas

DAX / GER TIME TO PRINT MONEY ON SHORTTeam, i have not been posting DAX/GER for almost 3-4 weeks
now it is time to attack the DAX.
I have set two different target ,
ensure you take 60% and bring stop loss to BE
I also want to give you the time frame for target to hit.. do not expect today, however we could see the target for tomorrow or early next week
Sometimes i wait for the right moment to trade. DAX is very sophisticated to trade with, but if you have the patience, you can make money on them.

Next week on GER40 The reason is that I am waiting for the price to reach the 50% PW level and form a 1-hour SMT + 5-minute CISD, then I will look for a buy opportunity. It is also possible that the market will consolidate above the HTF CISD, and after that, we will continue searching for a buy opportunity. Anyway, we will see what the market is doing INSHALLAH.

Quick take on DAXTariffs, no tariffs, tariffs, no tariffs... Let's look at the technical picture...
XETR:DAX
MARKETSCOM:GERMANY40
Let us know what you think in the comments below.
Thank you.
77.3% of retail investor accounts lose money when trading CFDs with this provider. You should consider whether you understand how CFDs work and whether you can afford to take the high risk of losing your money. Past performance is not necessarily indicative of future results. The value of investments may fall as well as rise and the investor may not get back the amount initially invested. This content is not intended for nor applicable to residents of the UK. Cryptocurrency CFDs and spread bets are restricted in the UK for all retail clients.

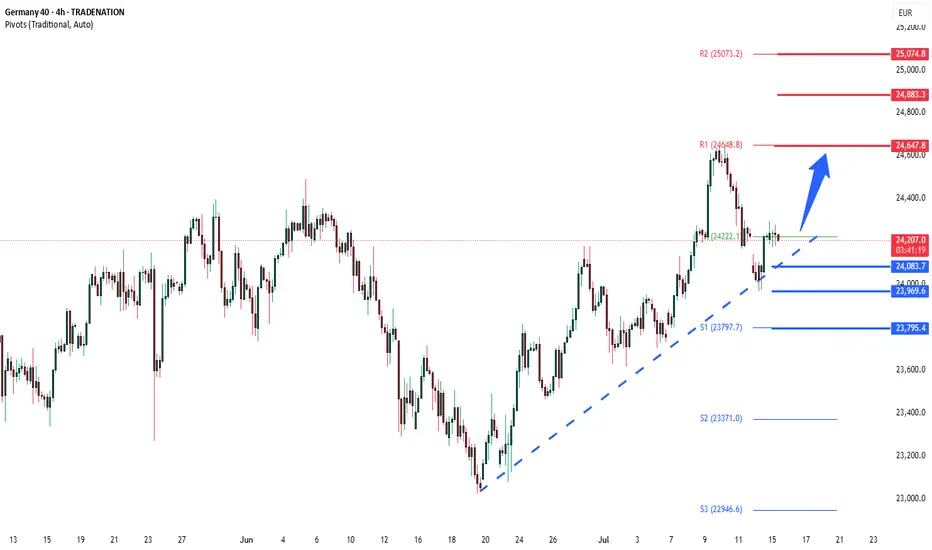
DAX corrective pullback supported at 24085The DAX remains in a bullish trend, with recent price action showing signs of a resistance breakout within the broader uptrend.
Support Zone: 24085 – a key level from previous consolidation. Price is currently testing or approaching this level.
A bullish rebound from 24085 would confirm ongoing upside momentum, with potential targets at:
24650 – initial resistance
24880 – psychological and structural level
25000 – extended resistance on the longer-term chart
Bearish Scenario:
A confirmed break and daily close below 24085 would weaken the bullish outlook and suggest deeper downside risk toward:
23970 – minor support
23800 – stronger support and potential demand zone
Outlook:
Bullish bias remains intact while the DAX holds above 24085. A sustained break below this level could shift momentum to the downside in the short term.
This communication is for informational purposes only and should not be viewed as any form of recommendation as to a particular course of action or as investment advice. It is not intended as an offer or solicitation for the purchase or sale of any financial instrument or as an official confirmation of any transaction. Opinions, estimates and assumptions expressed herein are made as of the date of this communication and are subject to change without notice. This communication has been prepared based upon information, including market prices, data and other information, believed to be reliable; however, Trade Nation does not warrant its completeness or accuracy. All market prices and market data contained in or attached to this communication are indicative and subject to change without notice.
trade with the trend The daily is going up, so we clearly should look for longs for better probabilities in our favor, and when the price approaches this level, I will buy
"Planning the Perfect DE40 Robbery? Here’s the Setup!"💥🔥Thief Trading Style: The Ultimate Market Heist Plan for DE40/Germany40🔥💥
"Steal the Trend, Escape the Trap, and Vanish with Profits!"
🌍🌟**Hola, Hallo, Marhaba, Bonjour, Ola, and Hey Traders!**🌟
Welcome to the Thief Trading Vault – where we don’t just trade, we plan market heists with precision and escape like professionals!
To all my fellow Profit Pirates, Smart Robbers, and Money Hunters – this one's for you. 🤑💸💼
🔐💹DE40/Germany40 Master Robbery Plan – Swing Trade Setup
Strategy Type: Swing & Scalp Friendly
Market Direction: Neutral ➜ Bullish Bias
Approach: DCA + Tactical Entry Zones + News-Conscious Trading
📍ENTRY (The Vault Is Open!)
Break in like a pro! We are eyeing a long entry setup.
Wait for price to dip near key pullback zones (within recent 15m or 30m swing highs/lows). Use buy limit orders to scale in.
🛠 Thieves love layering: DCA style entry strategy ensures lower average cost.
💡“Swipe smart, enter silently.”
📍STOP LOSS (Secure Your Exit!)
Our risk control is set at recent 4H swing low – around 23950.00.
However, your SL can vary based on risk profile, lot size, and number of entries.
Protect the stash! 💼🔒
📍TARGET (Getaway Point!)
🎯 Target: 24570.00 or exit early if resistance becomes tight.
We’re approaching a “Red Zone” – a high-risk area loaded with fake-outs, bear traps, and profit-takers.
🔁Scalpers' Goldmine Tips
Only scalp LONG SIDE ONLY.
Big accounts? Jump in anytime.
Small accounts? Tag along with swing setups.
Always use a trailing SL to secure gains and avoid traps.
🧠Technical + Fundamental Blend
This setup isn’t just chart-based.
We analyze:
🔍 Fundamentals & Macro Trends
🧾 COT Reports & Sentiment
🌐 Geopolitical Events
📊 Intermarket & Index-Specific Data
🧭 Trader Positioning & Future Price Bias
📎 Full outlook & premium research available – Klickk the Lnk🔗🧠
📢IMPORTANT REMINDERS:
⚠️ Major news releases = High risk.
Avoid fresh entries during those hours.
Use trailing SLs to lock profits during volatile sessions.
🚀Support The Thieves – Hit Boost!
Smash that 💥Boost Button💥 if this plan helped you plan your next profit heist.
More boosts = More strategies unlocked.
Join our elite robbers’ squad and conquer the market daily with the Thief Trading Style! 🏆💰❤️
📌DISCLAIMER:
This is a general swing trade strategy and not financial advice.
Always evaluate your own risk level and market understanding before entering trades.
Markets shift fast – adapt, stay sharp, and never trade blindly. 🎯
📅 Stay tuned – more robbery plans, more precision trades, and more fun ahead!
Follow & Boost if you want in on the next mission!
🕶️🐱👤 See you at the getaway spot!

Falling towards 50% Fibonacci support?DAX40 (DE40) is falling towards the pivot and could bounce to the pullback resistance.
Pivot: 24,122.25
1st Support: 23,935.80
1st Resistance: 24,622.91
Risk Warning:
Trading Forex and CFDs carries a high level of risk to your capital and you should only trade with money you can afford to lose. Trading Forex and CFDs may not be suitable for all investors, so please ensure that you fully understand the risks involved and seek independent advice if necessary.
Disclaimer:
The above opinions given constitute general market commentary, and do not constitute the opinion or advice of IC Markets or any form of personal or investment advice.
Any opinions, news, research, analyses, prices, other information, or links to third-party sites contained on this website are provided on an "as-is" basis, are intended only to be informative, is not an advice nor a recommendation, nor research, or a record of our trading prices, or an offer of, or solicitation for a transaction in any financial instrument and thus should not be treated as such. The information provided does not involve any specific investment objectives, financial situation and needs of any specific person who may receive it. Please be aware, that past performance is not a reliable indicator of future performance and/or results. Past Performance or Forward-looking scenarios based upon the reasonable beliefs of the third-party provider are not a guarantee of future performance. Actual results may differ materially from those anticipated in forward-looking or past performance statements. IC Markets makes no representation or warranty and assumes no liability as to the accuracy or completeness of the information provided, nor any loss arising from any investment based on a recommendation, forecast or any information supplied by any third-party.

DAX Stock Index Declines Amid Trump Tariff ThreatDAX Stock Index Declines Amid Trump Tariff Threat
The German stock index DAX 40 (Germany 40 mini at FXOpen) is showing bearish momentum at the start of the week. This may be driven by a combination of factors, the most significant of which is the threat of tariffs on Europe from the United States.
According to Reuters, US President Donald Trump has announced a 30% tariff on most goods from the EU, set to come into effect next month. However, the decision is not yet final. Analysts caution against premature panic, suggesting that negotiations could still result in a trade agreement — nonetheless, the chart reflects a sense of unease among investors.
Technical Analysis of the DAX 40 Chart
The price surge in July above the previous all-time high near the 24,500 level appears to be a false bullish breakout — a sign of market weakness.
Buyers may hope that the market will find support at the former resistance line (marked in red), drawn through the local highs of June.
However, if news surrounding the US–EU negotiations turns negative, the DAX 40 index could fall towards the 23,650–23,750 support area, which is reinforced by the lower boundary of the medium-term ascending channel.
This article represents the opinion of the Companies operating under the FXOpen brand only. It is not to be construed as an offer, solicitation, or recommendation with respect to products and services provided by the Companies operating under the FXOpen brand, nor is it to be considered financial advice.
Elliott Wave Outlook: DAX Set to Rally Higher in Wave 5Since April 7, 2025, the DAX Index has been advancing in a clear impulsive cycle, originating from a low that has set the stage for a structured upward movement. The initial advance, wave 1, concluded at 20468.43. It was followed by a corrective pullback in wave 2, which found support at 19384.39. The subsequent rally in wave 3 was robust, peaking at 24479.42, as depicted on the 1-hour chart. Wave 4 unfolded as a zigzag Elliott Wave pattern, characterized by a decline in wave ((a)) to 23360.16. A recovery in wave ((b)) took place to 23711.73, and a final dip in wave ((c)) to 23047.13, completing the corrective wave 4.
The Index then resumed its upward trajectory in wave 5, structured as an impulse in a lesser degree. From the wave 4 low, wave (i) reached 23481.97. A minor pullback in wave (ii) followed which ended at 23080.29. The rally then continued with wave (iii) peaking at 23812.79, a slight correction in wave (iv) to 23466.73, and the final leg, wave (v), concluding at 241200.82, marking the completion of wave ((i)).
A corrective wave ((ii)) found support at 23620.42, and the Index has since turned higher in wave ((iii)). As long as the pivot low at 23407.13 holds, the DAX is expected to extend its gains, with pullbacks likely finding support in a 3, 7, or 11 swing structure. This analysis suggests continued bullish momentum in the near term, with key support levels providing opportunities for further upside.

Is the Trend Intact? Key Signal Emerging on GER40 4H ChartHey Guys,
We could see a pullback on the GER40 index from the 24,060 level. If that happens, the 23,824 – 23,675 zone could present a potential buying opportunity. The primary trend still points upward, and bullish momentum remains intact.
Also worth noting—the rise in volume is quite striking, which supports my target level of 24,500.
I meticulously prepare these analyses for you, and I sincerely appreciate your support through likes. Every like from you is my biggest motivation to continue sharing my analyses.
I’m truly grateful for each of you—love to all my followers💙💙💙


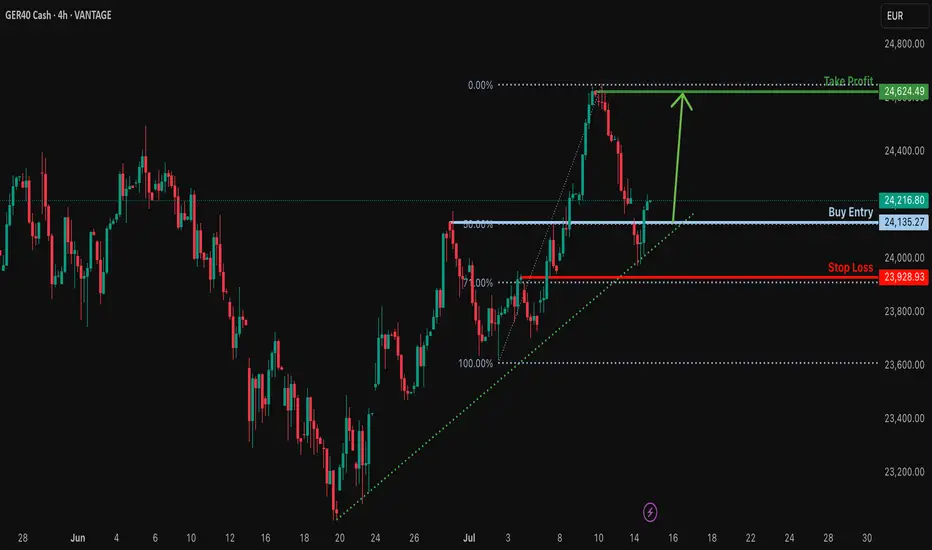
Bullish rise?GER40 has reacted off the support level which lines up with the 50% Fibonacci retracement and could potentially rise from this level to our take profit.
Entry: 24,135.27
Why we like it:
There is a pullback support that lines up with the 50% Fibonacci retracement.
Stop loss: 23,928.93
Why we like it:
There is a pullback support that aligns with the 71% Fibonacci retracement.
Take profit: 24,624.49
Why we like it:
There is a pullback resistance.
Enjoying your TradingView experience? Review us!
Please be advised that the information presented on TradingView is provided to Vantage (‘Vantage Global Limited’, ‘we’) by a third-party provider (‘Everest Fortune Group’). Please be reminded that you are solely responsible for the trading decisions on your account. There is a very high degree of risk involved in trading. Any information and/or content is intended entirely for research, educational and informational purposes only and does not constitute investment or consultation advice or investment strategy. The information is not tailored to the investment needs of any specific person and therefore does not involve a consideration of any of the investment objectives, financial situation or needs of any viewer that may receive it. Kindly also note that past performance is not a reliable indicator of future results. Actual results may differ materially from those anticipated in forward-looking or past performance statements. We assume no liability as to the accuracy or completeness of any of the information and/or content provided herein and the Company cannot be held responsible for any omission, mistake nor for any loss or damage including without limitation to any loss of profit which may arise from reliance on any information supplied by Everest Fortune Group.
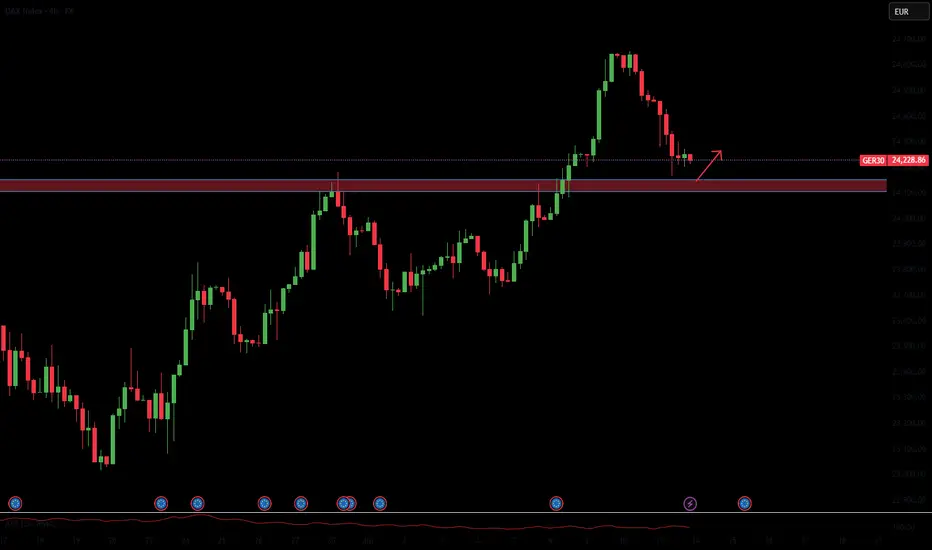
GER40 Breaks Resistance – Eyes Set on 25,000 The index has broken above the key resistance at 24,367 🔼, turning it into fresh support. This breakout confirms bullish momentum, with strong upward structure and follow-through candles.
Support Levels: 24,367 🔽, 23,718 🔽
Resistance Levels: 25,000 🔼
Bias:
🔼 Bullish: If price holds above 24,367, we may see a continued push toward 25,000.
🔽 Bearish: A drop below 24,367 could invalidate the breakout and shift momentum back to 23,718.
📛 Disclaimer: This is not financial advice. Trade at your own risk.

DAX (Ger40): Defying Global TensionsDespite all this tariff drama, the DAX hit another record high. What gives? Markets seem to be betting that Trump enjoys the threat of tariffs more than the implementation. Some traders are pricing in yet another extension beyond the August 1 deadline.
The DAX is riding momentum from both global AI enthusiasm, thanks to Nvidia’s $4 trillion market cap milestone, and the assumption that European exporters might dodge the worst of Trump’s trade penalties, at least for now. However, this rally is precarious. If a tariff letter hits Brussels, or copper tariffs ripple into industrial demand expectations, we could see a swift correction.
Technically, near term resistance is sitting around. 24,700. However as stated, should sentiment change. A correction back down, to the support level at 24,200, which also aligns with the 50 Fibonacci retracement level, could be on the cards. Or even all the way down to 23,800, aligning with the 88% Fibonacci level.

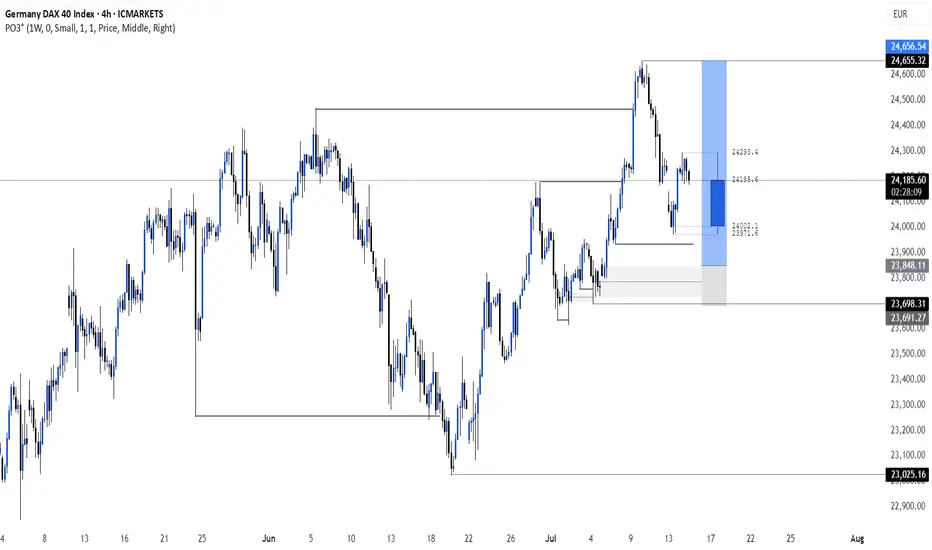
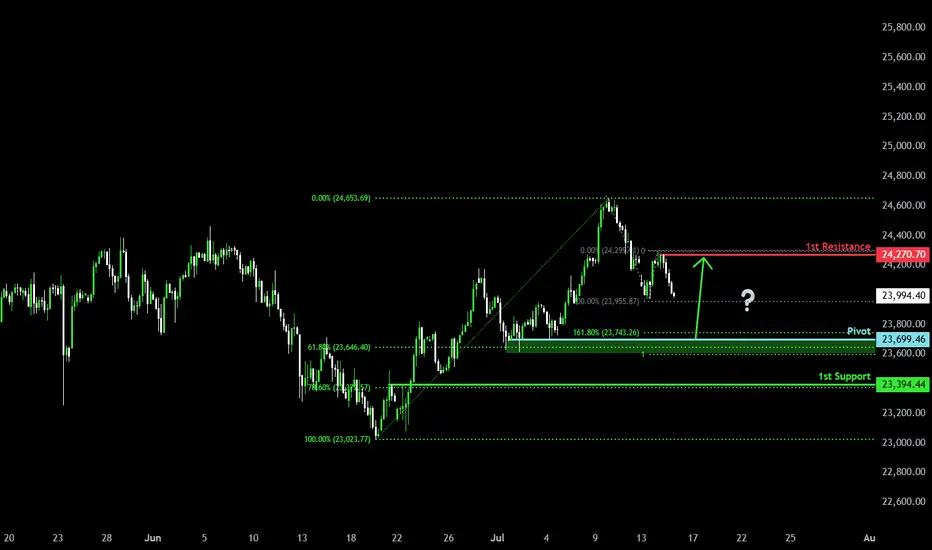
Falling towards Fibonacci confluence?DAX40 (DE40) is falling towards the pivot, which is a pullback support and could bounce to the pullback resistance.
Pivot: 23,699.46
1st Support: 23,394.44
1st Resistance: 24,270.70
Risk Warning:
Trading Forex and CFDs carries a high level of risk to your capital and you should only trade with money you can afford to lose. Trading Forex and CFDs may not be suitable for all investors, so please ensure that you fully understand the risks involved and seek independent advice if necessary.
Disclaimer:
The above opinions given constitute general market commentary, and do not constitute the opinion or advice of IC Markets or any form of personal or investment advice.
Any opinions, news, research, analyses, prices, other information, or links to third-party sites contained on this website are provided on an "as-is" basis, are intended only to be informative, is not an advice nor a recommendation, nor research, or a record of our trading prices, or an offer of, or solicitation for a transaction in any financial instrument and thus should not be treated as such. The information provided does not involve any specific investment objectives, financial situation and needs of any specific person who may receive it. Please be aware, that past performance is not a reliable indicator of future performance and/or results. Past Performance or Forward-looking scenarios based upon the reasonable beliefs of the third-party provider are not a guarantee of future performance. Actual results may differ materially from those anticipated in forward-looking or past performance statements. IC Markets makes no representation or warranty and assumes no liability as to the accuracy or completeness of the information provided, nor any loss arising from any investment based on a recommendation, forecast or any information supplied by any third-party.
DAX flirts with ATHs againAfter breaking out of the triangle formation a couple of days ago, the DAX is now flirting with the previous record hit in early June at 24490. With Trump's tariffs uncertainty at the forefront again, there is a possibility we could potentially see a double top or a false break reversal formation here, so do watch out for that. However, we will continue to focus on the long side until we see an actual, confirmed, reversal. With that in mind, dip-buying remains the preferred trading strategy.
Key support levels to watch:
24,278, marking yesterday's high
24,176, broken resistance from last week
23,927, the base of this week's breakout
The technical picture would turn bearish in the event we go back below the support trend of the triangle pattern.
In terms of upside targets,
24,750, marking the 127.2% Fib extension of the big drop from March
24,890, marking the 127.2% Fib extension of the most recent drop from June high
25,000, the next big psychological level
By Fawad Razaqzada, market analyst with FOREX.com

Technical Weekly AnalysisGermany 40 remains in a bullish trend but is currently undergoing a pullback phase. It is trading at 24,080, nearly matching its VWAP of 24,079. The RSI at 53 suggests moderate momentum. Support lies at 23,245, with resistance at 24,590.
The UK 100 continues its new bullish trend into all-time highs and is currently in an impulsive phase. With price at 8,962 above the VWAP of 8,813, it shows strong momentum. The RSI at 63 supports this outlook. Support stands at 8,652 and resistance is at 9,000.
Wall Street remains bullish but is in a pullback phase, trading at 44,192, slightly above the VWAP of 43,871. The RSI at 58 points to sustained buying interest. Support is at 42,404 and resistance is at 45,338.
Brent Crude is in a neutral trend within a ranging phase, trading at 7,058 just above the VWAP of 6,892. The RSI at 55 reflects a balanced market. Support is at 6,402, with resistance at 7,382.
Gold is also in a neutral trend and consolidating in a range. It is priced at 3,371, near its VWAP of 3,329. The RSI at 56 indicates mild bullish interest. Support sits at 3,269 and resistance is at 3,390.
EUR/USD maintains a bullish trend but is currently in a pullback phase. Trading at 1.1683, it is nearly aligned with the VWAP of 1.1690. The RSI at 55 indicates moderate strength. Support is at 1.1542 and resistance is at 1.1853.
GBP/USD is in a bullish trend but undergoing a correction. With price at 1.3485 below the VWAP of 1.3609, momentum appears to be easing. The RSI at 39 supports this softer tone. Support is at 1.3424 and resistance at 1.3793.
USD/JPY is testing the top of its sideways range. Currently at 147.33, it is above the VWAP of 145.41. The RSI at 64 suggests a potential new bullish phase is beginning. Support is at 142.91 and resistance at 147.92.

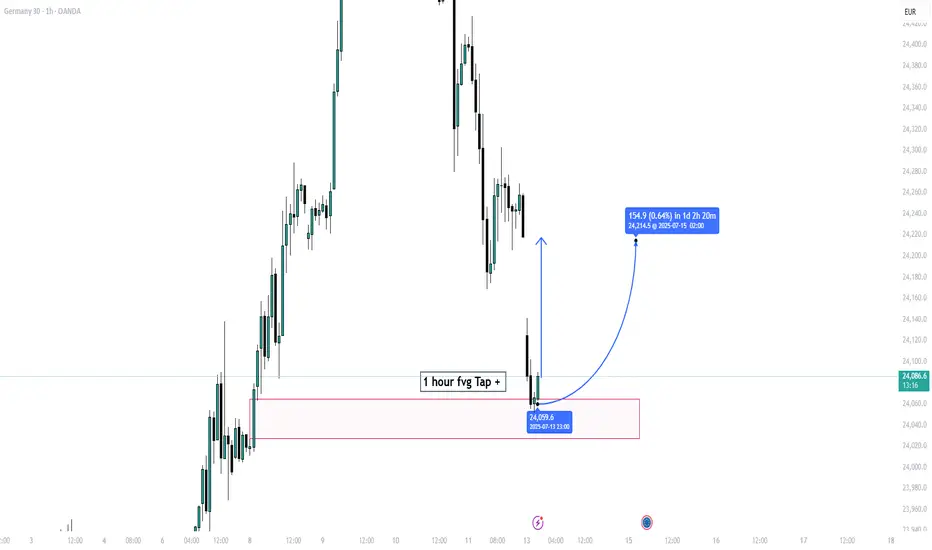
DE30EUR (German Index) Update – July 14, 2025📊 DE30EUR (German Index) Update – July 14, 2025
🕒 Time: 11:44 PM EST
💵 Current Price: 22,408.7
📍 Key Zone: 1-Hour Fair Value Gap (FVG) just tapped.
📈 Market Behavior:
Price has reacted strongly after filling the 1H FVG, showing early signs of bullish reversal. This aligns well with smart money concepts — we could be seeing the beginning of a move toward the upside.
🎯 Short-Term Target: 24,218
With confirmation from this FVG reaction, the move toward 24,218 looks promising.
Make German Index Great Again? DAX Moves in Silence While the World Screams 📊⚡
It’s loud out there — tariffs flying, currencies shifting, old alliances shaking.
We’ve got Trump hinting at tariffs against U.S. allies and China, the Euro flexing, the dollar facing devaluation talk, and a tangled mess of energy politics with Russia and Germany in the middle. All of this creates layers of macro uncertainty…
But in the middle of all that chaos?
📈 The chart speaks. And it’s speaking clearly.
🎯 What We’re Watching
On the 8H and 30M chart, DAX has printed a beautiful technical structure. And regardless of how things unfold on the political stage, the price action is offering us a clean framework.
🔹 Key S/R at 20,552
We are hovering around this pivotal level. Above it? Bulls regain control. Below it? Things get choppy, fast.
🔹 Main Support: 18,896
This is the level to hold. It’s structurally valid and tested. A break below here triggers the deeper scenario.
🔹 Scenario Breakdown:
Bullish Case (60%) — If 20,552 holds, DAX can re-ignite a rally toward:
22,248: interim resistance
23,870: all-time high zone
28,035: macro extension target
Bearish Case (40%) — If the key level is lost and we fall through 18,896, look out below:
16,978 minor support
14,408 becomes the "bad scenario" support
🔄 So… What Now?
We're not fortune tellers, and this isn't about guessing what the next political headline will be. We don’t need to understand the full implications of the euro/dollar dynamic or predict whether Germany will pivot on energy policy.
This is about the chart. Period.
📌 Above 20,552? I’m long toward 22K+
📌 Below it? I prepare for the slide
⚠️ Key decision zone right now. Market structure is everything.
Don’t get caught up in macro debates. The world may be unstable — but price action remains our anchor.
Trade the level, not the noise.
One Love,
The FXPROFESSOR 💙

DAX: Target Is Up! Long!
My dear friends,
Today we will analyse DAX together☺️
The in-trend continuation seems likely as the current long-term trend appears to be strong, and price is holding above a key level of 24,193.11 So a bullish continuation seems plausible, targeting the next high. We should enter on confirmation, and place a stop-loss beyond the recent swing level.
❤️Sending you lots of Love and Hugs❤️

