NAS100 - Stock Market Waiting for a New Stimulus?!The index is trading above the EMA200 and EMA50 on the four-hour timeframe and is trading in its ascending channel. If the index continues to move upwards towards the specified supply zone, one can look for further Nasdaq short positions with a risk-reward ratio.
Last week, financial markets experienced a brief sigh of relief as U.S. President Donald Trump appeared to ease tensions by signaling a limited retreat in the tariff war with China, sparking hopes for reduced friction. However, this optimism quickly faded once it became clear that Trump’s retreat was neither substantial nor impactful.
From Beijing’s perspective, the trade war has transcended economic concerns, becoming an issue of national pride and sovereignty. As a result, China, the world’s second-largest economy, is not retreating as easily as Trump anticipated. This stance has evolved into a significant challenge for the White House. U.S. officials indicated that tariffs of 145% could be reduced within two to three weeks if an agreement is reached.
Nonetheless, according to Chinese authorities, negotiations have yet to even begin, raising doubts about Trump’s negotiation tactics. Additionally, other concessions, such as reducing tariffs on American automakers, remain uncertain, and Trump has even threatened to raise tariffs on Canadian car imports.
This environment not only fails to clarify U.S. trade policy but also deepens uncertainty for domestic businesses. Although the White House claims it is monitoring markets closely and Trump is eager to strike deals with key partners, these assurances have not alleviated concerns about the future of the U.S. economy.
In the upcoming week, critical economic data could either intensify or ease current worries. On Tuesday, the Consumer Confidence Index for April and the JOLTS job openings data for March will be released. The highlight, however, will be the preliminary estimate of GDP growth, scheduled for Wednesday.
The Atlanta Fed’s GDPNow model forecasts a 2.2% annualized contraction in the U.S. economy for Q1 2025. Meanwhile, a Reuters survey of economists projects a modest 0.4% growth rate, a significant slowdown from Q4’s 2.4% growth.
Accompanying these reports, the ADP private-sector employment data and the Personal Consumption Expenditures (PCE) index will be published. The core PCE for March is expected to show a monthly increase of 0.1% and an annual rise of 2.5%, down from 2.8% previously. Personal spending is anticipated to maintain its 0.4% monthly growth, reflecting resilient household expenditures.
Additionally, on Wednesday, the Chicago PMI and pending home sales figures will be released. Thursday will bring the Challenger layoffs data for April, but market focus will be on the ISM manufacturing PMI, expected to drop from 49 to 47.9.
The week’s main event will be Friday’s release of the Nonfarm Payrolls (NFP) report. Forecasts suggest job growth will slow from 228,000 in March to 130,000 in April, while the unemployment rate is expected to remain at 4.2%. Wages are projected to rise by 0.3%.If NFP and PCE data come in weaker than expected, market expectations for a 25-basis-point rate cut by the Fed in June could intensify, although the likelihood of a cut in May will remain low. Such data would likely be bearish for the U.S. dollar but could support equity markets if recession fears do not dominate sentiment.
Some Federal Reserve officials have suggested that if economic conditions deteriorate significantly, rate cuts could start as early as June. Currently, the Fed has maintained high rates to combat inflation but may lower them to support growth and prevent a sharp rise in unemployment if necessary.
Trump’s trade wars pose a dual risk of increasing inflation while hurting employment, complicating the Fed’s monetary policy strategy. Presently, the Fed is in a “wait-and-see” mode, but several officials indicated last week that cuts could begin if economic data worsens.
Beth Hammack, President of the Cleveland Federal Reserve Bank, told CNBC on Thursday that the Fed might lower rates starting in June if signs of economic weakening due to Trump’s sporadic tariffs appear.
Christopher Waller, a Fed Board member, stated on Bloomberg TV that he could foresee rate cuts if the labor market collapses but does not expect such a scenario before July.
On Thursday, Waller remarked, “It would not be surprising to see an increase in layoffs and a higher unemployment rate, especially if major tariffs return. I would expect faster rate cuts once signs of severe labor market deterioration emerge.”
These comments highlight the Fed’s current dilemma as it awaits clearer evidence of significant economic fallout from Trump’s trade wars.
The Federal Reserve’s mandate is to maintain low inflation and unemployment levels. Its primary tool, the federal funds rate, influences borrowing costs across the economy. The Fed can stimulate growth by lowering rates or curb inflation by raising them.
Economists warn that Trump’s tariffs present the risk of simultaneously driving up inflation while damaging employment, forcing the Fed to prioritize which challenge to address first.
NAS100 trade ideas

Hanzo | Nas100 15 min Bullish Break– Confirming the Next Move🆚 Nas100 – Hanzo’s Strike Setup
🔥 Timeframe: 15-Minute (15M)
——————
💯 Main Focus: Bullish Breakout at 19575
We are watching this zone closely.
📌 If price breaks with high volume, it confirms Smart Money is in control, and a strong move may follow.
———
Analysis
👌 Market Signs (15M TF):
• Liquidity Grab + CHoCH at 19460
• Liquidity Grab + CHoCH at 19000
• Strong Rejections seen at:
➗ 19100 – Major support / Key level
➗ 19450 – Proven resistance
🩸 Key Zones to Watch:
• 19450 – 🔥 Bullish breakout level X 3 Swing Retest
• 19460 – Strong resistance (tested 5 times)
• 19100 – Equal lows
• 19500 – Equal highs
Hanzo | Nas100 15 min Breaks – Will Confirm the Next Move

Hanzo | Nas100 15 min Breaks – Will Confirm the Next Move🆚 Nas100 – Hanzo’s Strike Setup
🔥 Timeframe: 15-Minute (15M)
——————
💯 Main Focus: Bullish Breakout at 19550
We are watching this zone closely.
💯 Main Focus: Bearish Breakout at 19450
We are watching this zone closely.
📌 If price breaks with high volume, it confirms Smart Money is in control, and a strong move may follow.
———
Analysis
👌 Market Signs (15M TF):
• Liquidity Grab + CHoCH at 19460
• Liquidity Grab + CHoCH at 19000
• Strong Rejections seen at:
➗ 19100 – Major support / Key level
➗ 19450 – Proven resistance
🩸 Key Zones to Watch:
• 19450 – 🔥 Bullish breakout level X 3 Swing Retest
• 19460 – Strong resistance (tested 5 times)
• 19100 – Equal lows
• 19500 – Equal highs
Hanzo | Nas100 15 min Breaks – Will Confirm the Next Move

Technical Breakdown on US 100 1H TimeframeTechnical Breakdown on US100 1H Chart using Volume Profile, Gann, and CVD + ADX
1. Key Observations (Volume, Gann & CVD + ADX Focused)
a) Volume Profile Insights:
Value Area High (VAH): 20,080
Value Area Low (VAL): 19,720
Point of Control (POC):
Recent Session: 19,828.32
Previous Session: 19,760.96
High-volume nodes: Between 19,750 – 19,830 (acceptance zone with strong historical interest).
Low-volume gaps: 19,840 – 19,950 and above 20,100 (potential fast-move areas).
b) Liquidity Zones:
Stop Clusters Likely at:
Above 20,100 (psychological level and channel top).
Below 19,720 (value rejection zone).
Order Absorption Zones:
19,828 – 19,850 shows thick absorption based on CVD response and price stall.
c) Volume-Based Swing Highs/Lows:
Swing High: 20,080 (volume spike with slight wick rejection).
Swing Low: 19,700 (demand step-in area).
d) CVD + ADX Indicator Analysis:
Trend Direction: Uptrend (strong green candle series with rising CVD).
ADX Strength:
ADX > 20 with DI+ > DI- → Confirmed uptrend.
CVD Confirmation:
Rising CVD + bullish price action → Strong demand from market buyers, aligning with breakout above POC.
2. Support & Resistance Levels
a) Volume-Based Levels:
Support:
VAL: 19,720
POC (Current): 19,828.32
POC (Previous): 19,760.96
Resistance:
VAH: 20,080
Round number & psychological level: 20,100
b) Gann-Based Levels:
Gann Swing Low: 19,700
Gann Swing High: 20,080
Key Retracement Levels (Range: 19,700 – 20,080):
1/2: 19,890
1/3: 19,827
2/3: 19,953
3. Chart Patterns & Market Structure
a) Trend: Bullish (confirmed by rising ADX + CVD).
b) Notable Patterns:
Breakout from consolidation range above POC (strong volume confirmation).
Ascending channel structure supporting higher lows.
No divergence in CVD → healthy trend continuation signal.
4. Trade Setup & Risk Management
a) Bullish Entry (If CVD + ADX confirm uptrend):
Entry Zone: 19,828 – 19,850 (retest of POC/consolidation base)
Targets:
T1: 20,080 (VAH/Swing High)
T2: 20,200 (Channel Top)
Stop-Loss (SL): 19,700 (below swing low)
RR: ~1:2.3 minimum
b) Bearish Entry (If CVD + ADX flip bearish later):
Entry Zone: 20,080 – 20,100 (failure to break channel top)
Target:
T1: 19,828 (POC retest)
Stop-Loss (SL): 20,150 (above channel breakout zone)
RR: ~1:2
c) Position Sizing: Risk only 1-2% of capital per trade. Avoid oversized trades in extended trends.

Fear @ Greed Index In Nasdaq.The potential future decline of the Nasdaq index is attributed to concerns surrounding the Fibonacci level of 1.138, as indicated by the harmonic shark pattern .
At the 0.88 level, the fear index has surpassed the greed index, and it currently stands at 1.138. This apprehension is also affecting those who are typically driven by greed.

NQ: Crumbs left to the upsideGood day!
Following the weekly analysis, here are possible movements for the next few sessions.
As I mentioned few times now, there is still small room left to the upside followed by a consolidation before resuming the down trend with the beginning of Wave 3 and its Initial Swing.
Price has already made a new HH. Price might continue up without making a new HL. But I see a HL first. GL!

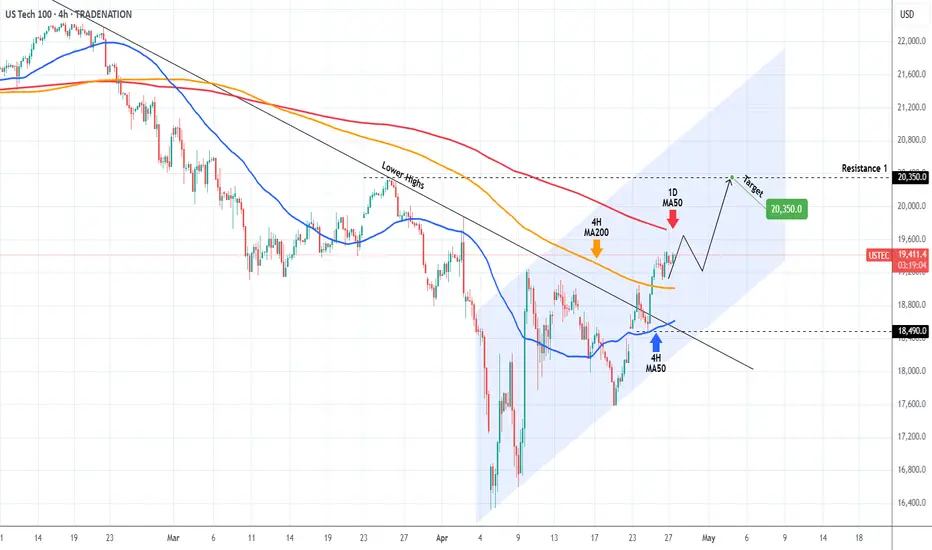
NASDAQ ahead of the most critical Resistance test.Nasdaq (NDX) not only broke above the Lower Highs trend-line of its All Time High (ATH) last week but managed to break and turn the 4H MA200 (orange trend-line) into Support.
It is now aiming for the 1D MA50 (red trend-line), which is the most crucial Resistance level of this recovery attempt and is what technically turns bearish trends into bullish if it turns into Support.
We expect a short-term rejection there, which should give a buy opportunity near the 4H MA200. Our Target for this is 20350 (Resistance 1).
-------------------------------------------------------------------------------
** Please LIKE 👍, FOLLOW ✅, SHARE 🙌 and COMMENT ✍ if you enjoy this idea! Also share your ideas and charts in the comments section below! This is best way to keep it relevant, support us, keep the content here free and allow the idea to reach as many people as possible. **
-------------------------------------------------------------------------------
Disclosure: I am part of Trade Nation's Influencer program and receive a monthly fee for using their TradingView charts in my analysis.
💸💸💸💸💸💸
👇 👇 👇 👇 👇 👇
Bullish bounce off pullback support?USTEC has reacted off the pivot which has been identified as a pullback support and could rise to the 1st resistance which is an overlap resistance.
Pivot: 19,189.77
1st Support: 18,580.75
1st Resistance: 20,258.77
Risk Warning:
Trading Forex and CFDs carries a high level of risk to your capital and you should only trade with money you can afford to lose. Trading Forex and CFDs may not be suitable for all investors, so please ensure that you fully understand the risks involved and seek independent advice if necessary.
Disclaimer:
The above opinions given constitute general market commentary, and do not constitute the opinion or advice of IC Markets or any form of personal or investment advice.
Any opinions, news, research, analyses, prices, other information, or links to third-party sites contained on this website are provided on an "as-is" basis, are intended only to be informative, is not an advice nor a recommendation, nor research, or a record of our trading prices, or an offer of, or solicitation for a transaction in any financial instrument and thus should not be treated as such. The information provided does not involve any specific investment objectives, financial situation and needs of any specific person who may receive it. Please be aware, that past performance is not a reliable indicator of future performance and/or results. Past Performance or Forward-looking scenarios based upon the reasonable beliefs of the third-party provider are not a guarantee of future performance. Actual results may differ materially from those anticipated in forward-looking or past performance statements. IC Markets makes no representation or warranty and assumes no liability as to the accuracy or completeness of the information provided, nor any loss arising from any investment based on a recommendation, forecast or any information supplied by any third-party.

EMA 60 capped the NASDAQ rallyThe NASDAQ’s rally was capped by the 60-day EMA, as ongoing tariff wars and the Federal Reserve’s reluctance to cut rates-or its intention to keep rates elevated for as long as possible-continue to weigh on investor sentiment. Given these headwinds, there is a risk that the NASDAQ may continue to slump.

Hanzo | Nas100 15 min Breaks – Will Confirm the Next Move🆚 Nas100 – Hanzo’s Strike Setup
🔥 Timeframe: 15-Minute (15M)
——————
💯 Main Focus: Bullish Breakout at 19450
We are watching this zone closely.
💯 Main Focus: Bearish Breakout at 19300
We are watching this zone closely.
📌 If price breaks with high volume, it confirms Smart Money is in control, and a strong move may follow.
———
Analysis
👌 Market Signs (15M TF):
• Liquidity Grab + CHoCH at 19460
• Liquidity Grab + CHoCH at 19000
• Strong Rejections seen at:
➗ 19100 – Major support / Key level
➗ 19450 – Proven resistance
🩸 Key Zones to Watch:
• 19450 – 🔥 Bullish breakout level X 3 Swing Retest
• 19460 – Strong resistance (tested 5 times)
• 19100 – Equal lows
• 19500 – Equal highs

X2: NQ/US100/NAS100 Short - Day Trades 1:2 RRX2:
Risking 1% to make 2%
NAS100, US100, NQ, NASDAQ Short for day trade, with my back testing of this strategy, it hits multiple possible take profits, manage your position accordingly.
Risking 1% to make 2%
Use proper risk management
Looks like good trade.
Lets monitor.
Use proper risk management.
Disclaimer: only idea, not advice


Is a reversal about to happen?Hello, traders
Orange circles highlight repeated price rejection and the formed doji that suggests a slowdown in a bullish wave and potential reversal. The confluence of the descending trendline and horizontal supply/resistance zone creates a high-probability reversal or breakout from this triangle.
If the price rejects again from the current supply zone and triangle, short setup toward the Fibonacci retracements or demand zones (18300 and below).
If the price breaks above the descending trendline, bullish continuation will likely target 20,000+ (Swing H).
Trend remains down.
Entry 19300
TP 18300 below
Target 14k.

NQ: Upcoming Weekly Analysis!FA Analysis:
1- We have two forces (Trump's team, policy and tweets and the FED) as market movers.
2- Trump's Team: Maintaining the UNCERTAINTY
- Minimum tariffs is 10% which is at least 500% of the original tariffs.
- Have a clear strategy: One screaming very high and the other one, the nice guy, offers 10-25% tariffs
- All the deals won't be binding deals; so they might change at any time. So uncertainty is still there.
- It's all about PR and looking good and winning
- Market understands very well what is happening. Market sees the 10% tariffs as a huge barrier.
=) So all what Trump is doing, including the final/big deals, are bad for stocks and equities.
3- The FED:
- Last FED did not provide any hint about June rate cut. FED is data related.
- Last macro-economic data did not help the FED Rate cut. Hence, the upcoming data is very relevant.
- This week, we have key inflation data: CPI and PPI. Higher Inflation data means NO June Cut which is very bad for stocks and equities. Inline and lower inflation data will help FED Cut which is good for stocks and equities.
=) From now on, Good macro-economic data is bad for stocks and equities and vice-versa.
TA Analysis:
Weekly TF:
- From weekly perspective, we got a bullish weekly candle than closed inside a bullish candle.
- Price seems exhausted and toppish. There is no need to go further up. But in any case, the chart shows two higher levels that price might reach in the case of bad economic data.
Daily TF:
- Friday candle was unable to close above the latest HH.
- Price always closed inside the consolidation area.
- Price will test the previous swing low (highlighted by a circle) in case Monday or US-China talks does not close above the latest HH.
=) From weekly and daily TF, NQ should go south.
Wish you a green week Everyone! GL!
(Note: I won't be around this week beside quick in and out; So I won't post most likely)

REPEATING 2022 PATTERN?We humans love to see patterns so we can try to understand our own existence and our perception of almost everything.
Very interesting comparison between 2022 and 2025. Though market conditions seem different we can see clearly the failed attempt to break above de 200 SMA in 2022. It may repeat again.

NASDAQ 100 on dayly This NASDAQ 100 chart shows an inverted Head and Shoulders pattern. The "head" is near 18,800, with the "left shoulder" and "right shoulder" around 19,200-19,400. The neckline is at approximately 19,800, and the price has broken above it, indicating a bullish reversal. The measured target is around 22,800, based on the pattern's height projected upward.

#NDQ - What does these lines say? Do they work?Hey, hope you are all doing great!
I strongly believe that you are looking at these charts to your advantage. Are the lines marked in these charts make any sense? Do these lines really work? check out these charts at a lower time frames and see. Since these are directionless, how to read?
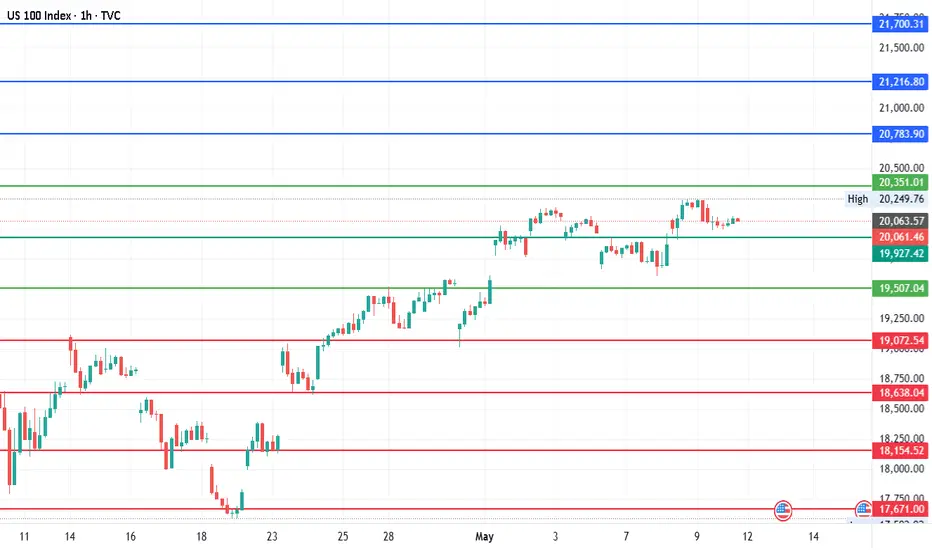
Current Price: 20061.45
Mid-line: 19927.42
Upside: 20783.90, 21216.80, 21700.31 and 22183.83
Downside: 19072.54, 18638.04, 18154.52 and 17671.00
#NDQ

Technical Breakdown on US 100 | 1H TimeframeTechnical Breakdown on US100 Cash (NASDAQ CFD) – 1H Timeframe using Volume Profile, Gann, and CVD + ADX
1. Key Observations (Volume, Gann & CVD + ADX Focused)
a) Volume Profile Insights:
Value Area High (VAH): 19,964.8
Value Area Low (VAL): 19,799.3
Point of Control (POC): 19,936.4 (current session), 19,817.5 (previous session)
High-volume nodes: 19,850 – 19,950 (sustained consolidation and acceptance)
Low-volume gaps: 20,000 – 20,070 (inefficient move up; could act as a magnet on retrace)
b) Liquidity Zones:
Stop clusters likely at:
Above 20,125 (recent high and breakout level)
Below 19,800 (previous rejection and consolidation)
Absorption zones: Near 19,820–19,850, where strong wicks and CVD upticks indicated passive buyers stepping in
c) Volume-Based Swing Highs/Lows:
Swing High: 20,125.8 (sharp rejection, low follow-through volume)
Swing Low: 19,713.4 (high absorption, spike in CVD)
d) CVD + ADX Indicator Analysis:
Trend Direction: Bullish (CVD rising, price confirming higher highs)
ADX Strength: ADX ~22, DI+ > DI- → Confirmed uptrend
CVD Confirmation:
Rising CVD + rising price = strong demand
Momentum stalling near 20,125, signaling potential short-term pullback
2. Support & Resistance Levels
a) Volume-Based Levels:
Support:
VAL: 19,799.3
POC: 19,936.4
Swing low: 19,713.4
Resistance:
VAH: 19,964.8
Swing high: 20,125.8
b) Gann-Based Levels:
Recent swing low: 19,713.4
Retracement levels (from 20,125.8 high to 19,713.4 low):
1/3: 19,850.9
1/2: 19,919.6
2/3: 19,988.3
3. Chart Patterns & Market Structure
a) Trend: Bullish (ADX > 20 with CVD and price agreement)
b) Notable Patterns:
Bullish channel breakout forming
Retest of 19,936 POC aligning with previous breakout level
Potential continuation pattern (ascending wedge forming within purple projection channel)
4. Trade Setup & Risk Management
a) Bullish Entry (CVD + ADX confirm uptrend):
Entry Zone: 19,925 – 19,940 (POC + Gann midpoint)
Targets:
T1: 20,070 (gap fill)
T2: 20,125 (recent high)
Stop-Loss (SL): Below 19,799 (VAL / swing low)
RR: Minimum 1:2
b) Bearish Entry (If rejection near swing high + falling CVD):
Entry Zone: 20,120 – 20,125
Target:
T1: 19,936 (POC)
Stop-Loss (SL): Above 20,150
RR: Minimum 1:2
c) Position Sizing:
Risk only 1-2% of capital per trade


a strategy i made with chatgpt in the works before market openThe strategy involve the use of to EMAs. The 10 and 20 EMAs. and i have an alert on Tradingview that tells me when the golden cross occurs and on the next candle after the golden cross thats where i am supposed to enter the trade but since i am working at this time i missed my entry but still got a good entry on the next reset and took a 2.5:1 trade and it panned out.

NS100 IS BULLISHPEPPERSTONE:NAS100 , The journey to NAS100 ATH is all about to kickstart, and it will do us good not to miss this moves. On this post, i shared analysis about NAS100 combining both H4, Daily and WeeklyTF together to form this analysis, for further details, see the content of the post.
