FOMO hurtsH1 pushed high enough from a FVG
Structure got broke giving another oppertunity to get in
Resting above we got a clear FVG on the Daily tf thats need to be filled
Well lets see What NFP brings to the table
Be safe out there🫡🫡
NAS100 trade ideas

Is Nasdaq still bullish? Steep correction today as expectedIf you look at my last post, you can see where I explained the expectation.
As range theory would state, the rejection from the bottom of a range creates a target in the high of the range. I have identified the candle top that I believe is the target for this rally.
If the bearish imbalance is stacked with too many orders we will not make it there. We are sitting right around the 50EMA for hourly as well as retesting the break point and bottom of the hourly bearish orderblock as I have marked.
It is in my opinion that the Void will act as a magnetic anomaly and assist in pulling price up as many institutional orders will be in that range, but we'll see 🔑
Share with a friend in need of real guidance 🫡


NASDAQ a look ahead...As the NASDAQ and other major U.S. Equity Indexes face the pressure of economic uncertainty, the price action between days show that investors are not quite convinced this bull run has seen its finish line. However, we shouldn't only be looking toward private investor sentiment, but also that of the Federal Reserve's presence in the market and how the bond market reflects the Fed's position moving forward.
As shown here, the all time high for the TVC:NDQ is $22,133.22. Our position is that the NASDAQ must reclaim, retest, and continue beyond the all time high in order for us to continue our confirmation on the bull run. The path described should look as shown below...
In this instance, we can assume the bull run should continue. However, we should also be prepared for an alternate scenario where investors leave risk assets behind to chase non-risk assets (bonds for example). This scenario would look as shown below.
All though these are not the only two possible scenarios, we can most likely expect the future to play out in a similar fashion as the examples.
As for the market metrics to keep an eye on, look to TVC:US10Y for any bond yield manipulation, FRED:RRPONTSYD for market liquidity metrics, and FRED:M1V for M1 money velocity. Furthermore, keep an eye on tariffs for consumer tech ( NASDAQ:AAPL , NASDAQ:NVDA , NYSE:TSM ) and military activity ( NYSE:LMT , NYSE:RTX , NYSE:NOC ). Lastly, keep an eye on the banking and financial sector for more than likely banking deregulations withing the coming years.


NSDQ100 INTRADAY trend change supported at 18950 Key Support and Resistance Levels
Resistance Level 1: 19590
Resistance Level 2: 20070
Resistance Level 3: 20344
Support Level 1: 18460
Support Level 2: 17820
Support Level 3: 17330
This communication is for informational purposes only and should not be viewed as any form of recommendation as to a particular course of action or as investment advice. It is not intended as an offer or solicitation for the purchase or sale of any financial instrument or as an official confirmation of any transaction. Opinions, estimates and assumptions expressed herein are made as of the date of this communication and are subject to change without notice. This communication has been prepared based upon information, including market prices, data and other information, believed to be reliable; however, Trade Nation does not warrant its completeness or accuracy. All market prices and market data contained in or attached to this communication are indicative and subject to change without notice.


US100 H4 | Bearish Fall Based on the H1 chart analysis, we can see that the price has just reacted off our sell entry at 19,514.93, which is ana swing high resistance.
Our take profit will be at 19363.72, a pullback support.
The stop loss will be placed at 19,637.23, above the 127.2% Fibo extension.
High Risk Investment Warning
Trading Forex/CFDs on margin carries a high level of risk and may not be suitable for all investors. Leverage can work against you.
Stratos Markets Limited (tradu.com):
CFDs are complex instruments and come with a high risk of losing money rapidly due to leverage. 63% of retail investor accounts lose money when trading CFDs with this provider. You should consider whether you understand how CFDs work and whether you can afford to take the high risk of losing your money.
Stratos Europe Ltd (tradu.com):
CFDs are complex instruments and come with a high risk of losing money rapidly due to leverage. 63% of retail investor accounts lose money when trading CFDs with this provider. You should consider whether you understand how CFDs work and whether you can afford to take the high risk of losing your money.
Stratos Global LLC (tradu.com):
Losses can exceed deposits.
Please be advised that the information presented on TradingView is provided to Tradu (‘Company’, ‘we’) by a third-party provider (‘TFA Global Pte Ltd’). Please be reminded that you are solely responsible for the trading decisions on your account. There is a very high degree of risk involved in trading. Any information and/or content is intended entirely for research, educational and informational purposes only and does not constitute investment or consultation advice or investment strategy. The information is not tailored to the investment needs of any specific person and therefore does not involve a consideration of any of the investment objectives, financial situation or needs of any viewer that may receive it. Kindly also note that past performance is not a reliable indicator of future results. Actual results may differ materially from those anticipated in forward-looking or past performance statements. We assume no liability as to the accuracy or completeness of any of the information and/or content provided herein and the Company cannot be held responsible for any omission, mistake nor for any loss or damage including without limitation to any loss of profit which may arise from reliance on any information supplied by TFA Global Pte Ltd.
The speaker(s) is neither an employee, agent nor representative of Tradu and is therefore acting independently. The opinions given are their own, constitute general market commentary, and do not constitute the opinion or advice of Tradu or any form of personal or investment advice. Tradu neither endorses nor guarantees offerings of third-party speakers, nor is Tradu responsible for the content, veracity or opinions of third-party speakers, presenters or participants.


Technical Breakdown on US100 | 1H TimeframeHere’s the detailed breakdown of the US100 1H Chart based on Volume Profile, Gann analysis, and custom indicators (CVD + ADX):
1. Key Observations (Volume, Gann & CVD + ADX Focused)
a) Volume Profile Insights:
Value Area High (VAH): 19,383
Value Area Low (VAL): 19,220
Point of Control (POC): 19,291.79
High-volume nodes: Clustered around 19,220 to 19,300 (heavy acceptance).
Low-volume gaps: Above 19,400 and below 19,200 — price can accelerate through these zones.
b) Liquidity Zones:
Stop clusters likely at: Above 19,400 (recent swing highs). Below 19,200 (recent breakout area).
Order absorption zones: Around 19,291 (POC) and 19,220 (high bid absorption).
c) Volume-Based Swing Highs/Lows:
Swing High: 19,382 (testing resistance with moderate volume).
Swing Low: 19,220 (breakout launch pad).
d) CVD + ADX Indicator Analysis:
Trend Direction: Uptrend
ADX Strength: ADX > 20 and DI+ > DI-, confirming strong bullish momentum.
CVD Confirmation: Rising CVD + bullish candles = Strong demand and genuine buying pressure.
2. Support & Resistance Levels
a) Volume-Based Levels:
Support: 19,291.79 (POC) 19,220 (VAL & previous demand zone)
Resistance: 19,382-19,400 (current tested highs and potential breakout point)
b) Gann-Based Levels:
Recent Gann Swing High: 19,382
Recent Gann Swing Low: 19,220
Key retracements: 1/2 level: 19,301 1/3 level: 19,274 2/3 level: 19,328
3. Chart Patterns & Market Structure
a) Trend:
Strong Bullish (confirmed by rising ADX and CVD).
b) Notable Patterns:
Ascending Channel: Clear uptrend with higher highs and higher lows inside the purple channel.
Breakout retest: POC retest around 19,291 before moving higher.
No major topping signals yet — still holding structure.
4. Trade Setup & Risk Management
a) Bullish Entry (If CVD + ADX confirm uptrend):
Entry Zone: 19,290–19,310 (near POC support zone)
Targets: T1: 19,400 (swing high breakout) T2: 19,500 (measured move from channel)
Stop-Loss (SL): 19,220 (below VAL and previous swing low)
RR: Minimum 1:2
b) Bearish Entry (If CVD + ADX confirm downtrend):
Entry Zone: 19,380–19,400 (at resistance failure)
Target: T1: 19,290 (POC retest)
Stop-Loss (SL): 19,450 (above resistance breakout trap)
RR: Minimum 1:2
c) Position Sizing:
Risk only 1-2% of trading capital per trade.

Gold Vs. Nasdaq, since 2022Fairly clear here that Gold and Nasdaq correlated in direction until December 2024, at which time the equities market peaked. The two continued to correlate in trend direction until February, where, after several years divergence finally occurred.
Gold continues upward, equities continue lower. This seems to be a clear indication that equities, in this case the Nasdaq, will continue into downward correctional territory while Gold continues into a positive trending direction.

Gold Vs. Nasdaq, since 2017 Using momentum indicators, the Nasdaq is overbought and seems to be retreating a bit off of that region. Gold is continuing to move into the overbought region of momentum.
The two are following more of a correlation up until now. This current movement marks divergence, which is what is expected. This coincides with the expectation that Gold and equities will trend in opposite directions.
In other research, it is noted that when there is correlation followed by divergence, it is typically the equity which was over-extended and will retrace back against Gold's more gradual movement. Gold typically keeps pace with inflation.

NAS100 Bulls Rally – Eyes on 19,860 Resistance Zone!"The NAS100 is sustaining a strong bullish rally after reclaiming the 19,150 🔽 support zone. Price is trading firmly within a bullish structure, but still has some distance to reach the next key resistance at 19,860 🔼.
Currently trading at 19,446, with
Support at: 19,150 🔽, 18,500 🔽, 17,600 🔽
Resistance at: 19,860 🔼, 20,347 🔼
Bias:
🔼 Bullish: As long as price holds above 19,150, bulls remain in control. A breakout and retest above 19,860 could fuel a further move toward 20,347.
🔽 Bearish: A rejection from 19,860 or a break below 19,150 could trigger a decline toward 18,500.
No breakout, no trade.
📛 Disclaimer: This is not financial advice. Trade at your own risk.


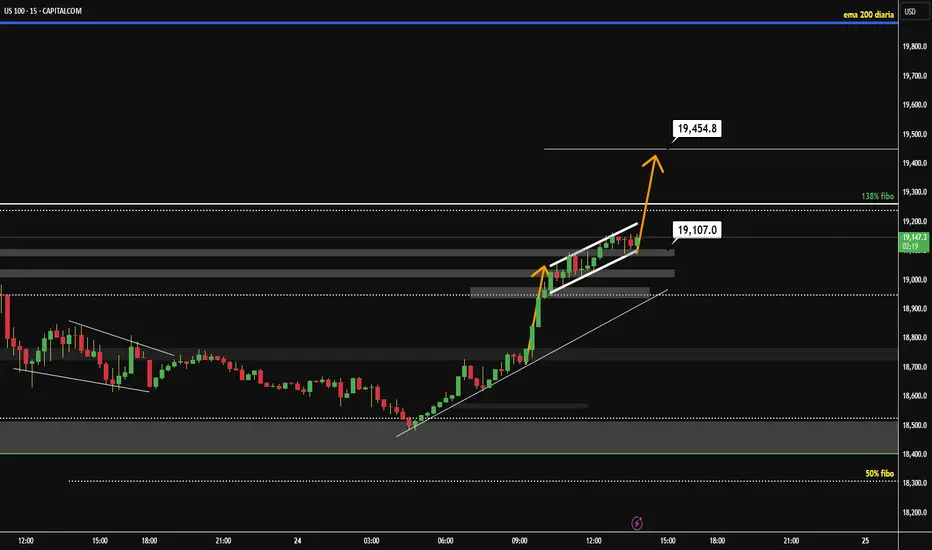
Bullish Continuation Setup Towards📈 US100 - Bullish Continuation Setup Towards 19,454.8 🚀
After a strong impulsive move, US100 is consolidating inside a rising channel, forming a classic bull flag structure. Price has respected multiple demand zones on the way up and currently sits just above the key support at 19,107.0. The bullish momentum is supported by a clean structure of higher highs and higher lows, and a breakout from the flag could trigger the next leg up toward the 138% Fibonacci extension level at 19,454.8.
As long as price holds above the 19,000–19,107 support zone, this scenario remains valid. Keep an eye on volume and a breakout candle for confirmation. 📊💥

NQ: Upcoming Weekly Analysis!FA Analysis:
1- Earnings season: In my view, it's irrelevant in terms of the data itself! It reflects the pre-tariffs era. Market is always looking forward. However, it gives market the opportunity for a relief, consolidation and rebalancing. So beside the kneejerk reaction, uncertainty is in the driver seat.
2- Trump's policies: The 90-day pause has a big chance to become an Eternity pause. Cracks inside Trump's team about the impacts of these tariffs on their own corporations will make them fleeing Trump's boat. Hence, the rational supporting the Eternity pause. This said, we'll see many tweets highlighting how much Trump is winning to feed his mindset.
3- Key economic data: Economic data will take over the driver seat. Recession and Inflation are the key data for market. Bad data is bad for Equities and vice-versa.
4- FED: Rate cut has increased probability during the next meeting, but for the wrong reasons. Both Trump and market will continue their pressure on the FED. This pressure is translated via Sell-off of stocks and equities.
5- Risk: Beside the uncertainty context, I think agreements between Iran-USA and Ukraine-Russia are underway. This is positive for equities. Gold is your indicator in this front.
TA Analysis:
Weekly TF:
- Not much to update from two weeks ago analysis! Price is in its way to complete Wave 2. Crumbles left.
- Price broke out and closed above the 90-day pause weekly/daily candle. This tells you a continuation up is expected but not too much left in the upper side.
- Economic Data will drive the move. This might last 1-2 weeks.
Daily TF:
- Green daily close with a small size candle.
- A consolidation period is expected to end this Wave 2. So there is no rush to jump in the sell side to catch the top of Wave 3. Here is a good opportunity for swing position that you can build incrementally as the price creates LL from lower TF up to Daily and Weekly TF.
GL!

Price breaking out of a wyckoff balance to go unbalanceMy approach the market was pointing out market had found a balance zone starting on April 9th- today. Today I notice high volume on the bull side towards one of the resistance points which it broke and retraced. One it started to retrace I went to the smaller time frame to look for a sniper entry( 5min bullish and strong delta candle stick rejecting of a low volume node and the session vwap ). The balance zone was $1450 wide so it should go imbalance for the same amount or close. This trade is really a 25rr but im going for 8rr to pass my 2nd phase in my challange. This trade will not hit instill like Wednesday maybe even to the end of next week.


