RUSSELL Overbought for the 3rd time in 7 months. Sell.Last time we had a look at Russell 2000 (RUT) was 2 months ago (November 28 2025, see chart below) where we gave a strong Buy Signal that quickly hit our 2600 Target:
This time, with the price approaching the top (Higher Highs trend-line) of its 10-month Channel Up, the technical sentiment turn

US2000--Head and Shoulder--Head and Shoulder pattern
--Short bias
--Entry and tp levels are as shown on the chart

US2000 H4 | Bullish Momentum To Extend?Based on the H4 chart analysis, we could see the fall to our buy entry level at 2,601.61, which is a pullback support that is slightly above the 50% Fibonacci retracemnt.
Our stop loss is set at 2,554.64, which is a pullback support that aligns with the 61.8% Fibonacci retracement.
Our take profit


US2000 H1 | Bullish Bounce OffThe price has bounced off our buy entry level at 2,641.87, which is a pullback support.
Our stop loss is set at 2,600.84, which is a pullback support that aligns with the 78.6% Fibonacci retracement.
Our take profit is set at 2,708.35, which is a pullback resistance.
High Risk Investment Warning

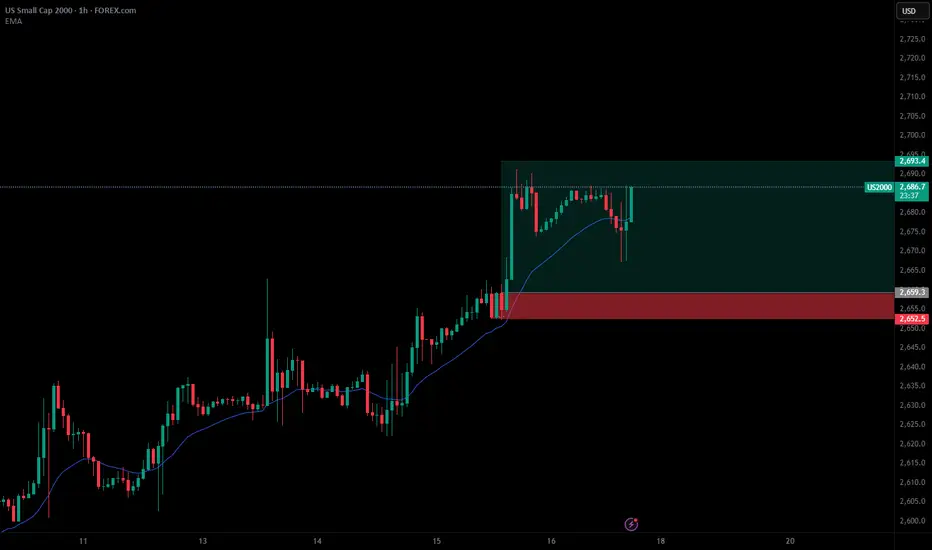
US2000 H1 | Bearish Reversal SetupBased on the H1 chart analysis, we could see the price rise towards our sell entry level at 2,692.02, which is a pullback resistance that aligns with the 50% Fibonacci retracement.
Our stop loss is set at 2,738.46, which is a swing high resistance.
Our take profit is set at 2,626.00, which is a mu

US2000 (Russell) eyes on $2690: Golden Genesis fib may give DIP Small caps have been flying strong for some time now.
US2000 index just hit a Golden Genesis fib at $2690.66
Look for a Break-n-Retest or Dip-to-Fib to join trend.
.
See "Related Publications" for other examples of Golden fibs at work ----->>>>>>>>>>>
.

SHORT 2000Probable corrective move towards a key liquidity zone on the 15-minute timeframe.
Analysis based on market structure and short-term liquidity levels.
Invalidations: above the recent 15M swing highs.
Target: identified liquidity zone.
⚠️ Informational analysis only – not financial advice.

RUSSELL 2000 — Follow-up on prior liquidity-based scenario (15M)This post provides a follow-up observation on a previously published liquidity-based scenario.
Price has since interacted with the identified liquidity zone, with market behavior aligning with the initial structural framework.
This follow-up is shared for documentation purposes only and does not c

See all ideas
Displays a symbol's value movements over previous years to identify recurring trends.
Frequently Asked Questions
US Small Cap 2000 reached its highest quote on Jan 22, 2026 — 2,736.8 USD. See more data on the US Small Cap 2000 chart.
The lowest ever quote of US Small Cap 2000 is 938.6 USD. It was reached on Feb 11, 2016. See more data on the US Small Cap 2000 chart.
US Small Cap 2000 is just a number that lets you track performance of the instruments comprising the index, so you can't invest in it directly. But you can buy US Small Cap 2000 futures or funds or invest in its components.