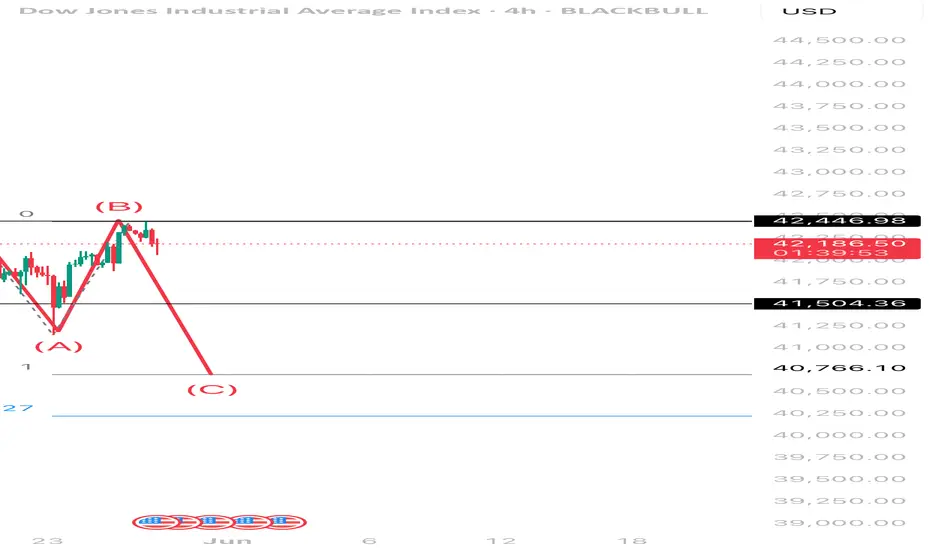
US30 Short - Elliotts Impulse and correction wavesWe see an impulsive move (1-5) and now completing corrective wave (A-C) with targets at Fibonacci extension 1.27
US30 trade ideas

Price Patterns Every Trader Should KnowLearn how to trade using price patterns! In this video, we cover continuation, reversal, and bi-directional patterns, including flags, wedges, triangles, and more. You'll see schematics, real chart examples, and learn how to combine them with confluence for better setups.
#PriceAction #ChartPatterns #TechnicalAnalysis #TradingStrategy #ForexTrading #CryptoTrading

Dow Jones Inverse Head and Shoulders Pattern on H1 TFPrice was retested and rejected in an H4 demand zone following a massive pullback. Since then, it has been showing consistent higher highs and higher lows on H1 and has now confirmed a bearish-to-bullish reversal in the form of an inverted head-and-shoulders pattern. Whether or not there is a minor pullback, as indicated by the arrows pointing to the downside, the overall bias is bullish, as per the confirmations mentioned.

SHORT ON US30US30 Has given us a nice pullback to a major supply area.
I am expecting price to rise a little higher into the supply are then give us a major drop to the previous swing low for over 1000 points!!!
I have placed a sell limit order withing the supply area looking to short us30 for the rest of the week.

DOW JONES Holding the 1D MA50 can propel it to 45000.Dow Jones (DJI) contained Friday's Trump-led pull-back just above its 1D MA50 (blue trend-line), marking the strongest correction since April 21. So far that is purely a technical reaction to the Resistance 1 (42855) rejection a day earlier.
This is forming an Inverse Head and Shoulders (IH&S) but above all, as long as the 1D MA50 holds, it is a bullish continuation of April's rebound/ Bullish Leg at the bottom of the long-term Bullish Megaphone pattern and on the 1W MA200 (red trend-line).
As you can see, the 1W MA200 has been the ultimate Support of this pattern and last time it started a rebound that broke above the 1D MA50 and retested it, was on the first Bullish on November 09 2023.
That pull-back held the 1D MA50 and the price action continued the bullish trend until it completed a +23.69% rise, before the next 1D MA50 break.
As a result, as long as the 1D MA50 holds, we expect at least another +23.69% rise on the medium-term, which this times falls on the Resistance 2 level (45100), aligning perfectly for a technical test. Our Target will be a little lower at 45000.
-------------------------------------------------------------------------------
** Please LIKE 👍, FOLLOW ✅, SHARE 🙌 and COMMENT ✍ if you enjoy this idea! Also share your ideas and charts in the comments section below! This is best way to keep it relevant, support us, keep the content here free and allow the idea to reach as many people as possible. **
-------------------------------------------------------------------------------
Disclosure: I am part of Trade Nation's Influencer program and receive a monthly fee for using their TradingView charts in my analysis.
💸💸💸💸💸💸
👇 👇 👇 👇 👇 👇

US 30 Technical Analysis US30 Monthly, Weekly, and Daily Technical Analysis
Note: For educational purposes only. This is not financial advice.
Monthly Timeframe:
In April, the US30 (Dow Jones Industrial Average) posted a high of 42,548 and a low of 36,483. The April candle closed within the range of the March candle, signaling strong buying interest, likely driven by fundamental data. The key takeaway from the monthly chart is that April’s close within March’s range highlights buyer strength and the potential for continued bullish momentum.
Weekly Timeframe:
The bullish channel remains intact on the weekly timeframe. Although price briefly broke below the trendline, it quickly rebounded and re-entered the channel in the first week of April.
There has been no break of structure on the weekly chart. Last week's high at 42,858 swept the previous week’s high but closed within the previous week’s range, ending precisely at the prior week’s low. This indicates unclear price action and potential indecision.
If the upcoming week closes above the 43,100 level, this week’s low could be considered a weekly inducement, adding confluence for a potential bullish move. Until then, it remains just a weekly low without significant structure.
Daily Timeframe:
On the daily chart, price action remains indecisive, with no valid break of structure to confirm an upward trend continuation. However, there is a key support zone between 40,800 and 40,660, which aligns with a confluence of a daily trendline—potentially forming a buy zone, but only upon confirmation on lower timeframes.
Interestingly, the price has ranged between the same levels during the periods from March 13 to March 27 and from April 1 to May 20, reinforcing the range-bound nature of the market.
Outlook:
Given the lack of clear directional bias, scalping opportunities may be more appropriate in the upcoming week, especially if the market continues to range. A strong breakout and close above 43,150 could signal a bullish continuation, in which case we would look for a pullback and hold of long positions, targeting the 44,500 level.

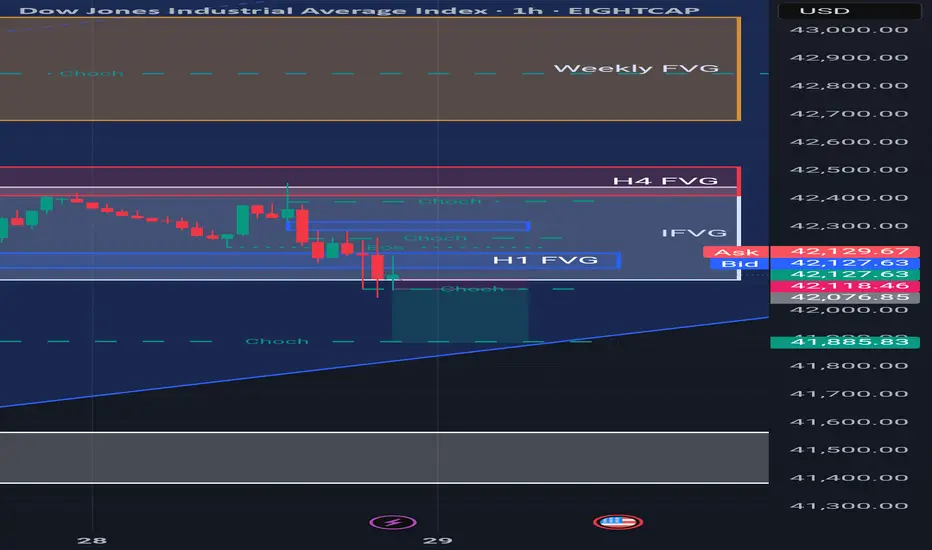
Us30 sell Key Elements:
Price: 41,579.16 (at the time of the screenshot), showing a drop of -343.51 points (-0.82%).
Zones:
Weekly FVG (Fair Value Gap): Around 42,750–43,000.
Daily FVG: Around 42,100.
Daily High/Low: Marked around 42,095.82 (high) and 41,147.61 (low).
Market Structure:
CHoCH (Change of Character): Several CHoCHs marked, indicating shifts in market sentiment and structure.
BOS (Break of Structure): Indicates previous bullish momentum was broken.
---
Prediction Path (Orange Arrow):
Suggests a possible retracement upward into the Daily FVG zone (~42,000+), then a reversal downward, breaking the Daily Low (~41,147).
Final target seems to be near 40,500 or lower, with another CHoCH noted at that level—implying further bearish continuation potential.
---
Interpretation:
The chart suggests a bearish bias:
Retracement to fill the Daily FVG.
Then continuation downward, breaking key structural levels.

KOG - US30Quick update on this as it's looking like it's stretching out early buyers and has caught some at the top.
We've added the red boxes to this and we're keeping a close eye on that lower one around 41400-500 as long as 42000 holds us down. If we get it we get it, but it needs to go straight down before going up.
As always, trade safe.
KOG

DOW JONES: Channel Up targeting 43,400.Dow Jones is practically neutral on its 1D technical outlook (RSI = 55.880, MACD = 380.350, ADX = 13.770) as the price is consolidating on its 4H MA50. Despite the neutrality, it remains inside the Channel Up, that is supported by the 4H MA200 and whose 4H RSI squeeze indicates we might be on a similar slow uptrend as late April's. We expect a similar +5.60% rise from the HL bottom, TP = 43,300.
## If you like our free content follow our profile to get more daily ideas. ##
## Comments and likes are greatly appreciated. ##

US30 Footprint Update | May 29, 2025We're witnessing a clear shift in order flow dynamics on the 1H footprint chart.
🔻 Earlier in the session, sellers were firmly in control with heavy negative delta and large sell imbalances between 42,280–42,120.
🔄 Key Change: Around 42,088–42,177, aggressive selling was absorbed, followed by a strong bullish delta of +125 and increasing buyer interest in the following candles. Volume has flipped in favor of buyers.
📈 Current Price: Holding around 42,191.50, just below the key resistance zone of 42,231. A clean break and acceptance above this level could confirm a bullish shift toward 42,280–42,300.
🧠 What I’m Watching:
Break and hold above 42,231 = long continuation
Failure to sustain = possible retest of 42,177 or lower support
🎯 Volume and delta are aligning in favor of bulls — let’s see if they can take control.


US30 BUY MODELDOW JONES (US30) – Long Trade Idea
Timeframes:
Higher Timeframe Bias: Daily
Execution Timeframe: 4HR
Market Narrative:
A beautiful buy model is currently unfolding on the Dow, suggesting smart money accumulation and preparation for a move into premium pricing.
Price is retracing into discount, where we see a confluence of:
A Daily Bullish Order Block (OB)
A 4HR Buy-Side Imbalance / Sell-Side Inefficiency (BISI)
This confluence acts as a strong magnet for price and presents a high-probability long opportunity.
Entry Zone:
🟢 Buy Zone: 41,900 – 41,850
Inside the 4HR BISI
Aligned with the Daily OB (discounted price)
Ideal for entries upon confirmation via:
1HR bullish BOS (Break of Structure)
FVG (Fair Value Gap) entry
Internal liquidity sweep + displacement
Targets (Premium-side Liquidity & Imbalances):
TP1 – 42,500
🎯 First premium inefficiency fill + short-term liquidity target
TP2 – 42,800
🎯 Key level inside Daily SIBI (Sell-Side Imbalance, Buy-Side Inefficiency)
TP3 – 43,060
🎯 February Low above current price — likely a buy-side liquidity draw
Risk Management:
Stop Loss: Below 41,700
🔒 Below Daily OB low and structural invalidation level
RRR: At least 1:3 to TP1, and 1:6+ to final target
Key Confluences:
Daily OB + 4HR BISI = strong demand and imbalance alignment
Trading in discount of the current dealing range
Clear buy-side liquidity pools above (including February Low)
Market structure remains bullish on higher timeframes
Strong probability of price delivering higher into premium
Execution Tips:
Wait for confirmation inside the 41,900–41,850 zone:
15min–1HR bullish market structure shift (BOS)
Fair Value Gap + displacement candle entry
Consider partial profits at TP1, and trail stops for extended targets
Avoid entries during high-impact news unless already in profit

Hanzo / US30 30M Path ( Confirmed Bullish Breakout Zones )🆚 US30
The Path of Precision – Hanzo’s Market tactics
🔥 Key Levels & Breakout Strategy – 15M TF
☄️ Bullish Setup After Break Out – 42240 Zone
Price must break liquidity with high volume to confirm the move.
Reasons
Bullish After Break
42250
🚀 1hr key level
Retest - History
27 May / 2025
21 May / 2025
19 May / 2025
16 May / 2025
15 May / 2025
14 May / 2025


US30Correlation Between US30, 10-Year Bond Yields, Bond Prices, and DXY
1. Bond Prices vs. Yields
Inverse Relationship: Bond prices and yields move inversely. When bond prices rise, yields fall, and vice versa.
Example: If the 10-year Treasury bond price drops (due to selling pressure), its yield rises to attract buyers.
Current 10-year yield: 4.54% (as of May 21, 2025).
2. 10-Year Yield vs. DXY (US Dollar Index)
Typical Positive Correlation: Higher yields attract foreign capital into USD-denominated assets, strengthening the dollar (DXY↑).
Recent Divergence:
A rising 10-year yield paired with a weakening DXY may signal market skepticism about Fed policy or risk aversion (e.g., investors favor Treasuries as safe havens despite lower yields).
Example: If yields rise due to inflation fears without economic growth, DXY may weaken as traders doubt the Fed’s ability to sustain rate hikes.
3. DXY vs. US30 (Dow Jones Industrial Average)
Inverse Correlation: A weaker dollar (DXY↓) often supports equity indices like US30, as multinational companies benefit from cheaper exports and higher overseas earnings.
Exceptions:
In risk-off environments, a stronger dollar (DXY↑) may coincide with equity sell-offs as investors flee to safe-haven assets.
4. 10-Year Yield vs. US30
Mixed Relationship:
Negative: Rising yields can pressure equities (US30↓) as higher borrowing costs reduce corporate profits and make bonds more attractive.
Positive: Yields rising due to growth optimism may lift stocks (US30↑) if earnings expectations improve.
5. Yield Curve Dynamics (30-10 Year Spread)
Current Spread: 0.51% (30-year yield: 4.94%, 10-year yield: 4.43%).
Implications:
A widening spread (30-year > 10-year) suggests long-term growth/inflation expectations.
A flattening/inverted spread signals economic uncertainty or recession fears.
Summary Table of Relationships
Factor Relationship with DXY Relationship with US30
10-Year Yield ↑ Typically ↑ (if growth-driven) ↓ (if rate-driven) / ↑ (if growth-driven)
Bond Prices ↑ ↓ (yields fall, USD less attractive) ↑ (cheaper borrowing)
DXY ↑ — Typically ↓ (hurts exports)
30-10 Spread Widens Neutral ↑ (growth optimism)
Key Scenarios
Risk-On Environment:
DXY↓ + US30↑ + Yields↑ (growth optimism).
Example: Weaker dollar boosts equities despite rising yields.
Risk-Off Environment:
DXY↑ + US30↓ + Yields↓ (safe-haven demand for bonds and USD).
Policy Divergence:
Yields↑ + DXY↓ (markets doubt Fed’s ability to sustain hikes despite inflation).
Conclusion
The interplay between US30, bond yields, prices, and DXY is dynamic and context-dependent:
Yield-DXY Link: Normally positive but can diverge during policy uncertainty or risk aversion.
DXY-US30 Link: Typically inverse but influenced by macroeconomic drivers.
Yield Curve: A widening 30-10 spread supports growth optimism, while flattening signals caution.
Traders must monitor Fed policy, inflation data, and risk sentiment to navigate these correlations effectively.

Dow Jones Continues Its Upward Momentum Toward the 43,344 Level The Dow Jones Industrial Average is showing continued bullish momentum, with an anticipated move toward the 43,344 level following a retracement to the support zone around 42,290–42,250. A price close above last week’s closing level reinforces the bullish sentiment, providing further upward momentum for the index toward the targeted levels outlined in the accompanying chart.
#Dow Jones Industrial Average
#US30
#Technical Analysis
#Chart Patterns
#Price Action
#Global Markets
#Market Outlook
#Swing Trading


Hanzo / US30 15m Path ( Confirmed Breakout Zones )🆚 US30
The Path of Precision – Hanzo’s Market tactics
🔥 Key Levels & Breakout Strategy – 15M TF
☄️ Bullish Setup After Break Out – 42240 Zone
Price must break liquidity with high volume to confirm the move.
Reasons
Bullish After Break
42250
1hr key level
Retest - History
27 May / 2025
21 May / 2025
19 May / 2025
16 May / 2025
15 May / 2025
14 May / 2025
☄️ Bearish Setup After Break Out – 42075 Zone
Reasons
1hr key level
Retest - History
26 May / 2025
27 May / 2025
And Next Key level Is Far
41925
we have 150 PIP Range


Hanzo / US30 15m Path ( Confirmed Breakout Zones )🆚 US30
The Path of Precision – Hanzo’s Market tactics
🔥 Key Levels & Breakout Strategy – 15M TF
☄️ Bullish Setup After Break Out – 42100 Zone
Price must break liquidity with high volume to confirm the move.
☄️ Bearish Setup After Break Out – 41920 Zone
Price must break liquidity with high volume to confirm the move.
🩸 15M Time Frame Confluence
————
CHoCH & Liquidity Grab @ 41540
Key Level / Equal lows Formation - 41900
Strong Rejection from 42100 – The Ultimate Pivot
Strong Rejection from 41180 – The Ultimate Pivot
🔥 1H Time Frame Confirmation
Twin Wicks @ 42100 – Liquidity Engineered
Twin Wicks @ 41750 – Liquidity Engineered
Hanzo / Gold 15m Path ( Confirmed Breakout Zones )
