The Dow Jones Begins to Stabilize Around 42,500 PointsThe U.S. index has halted the advance of its recent bullish moves near this resistance zone, mainly because the market is awaiting the release of the Federal Reserve minutes later today, along with Nvidia’s earnings report, expected after the stock market close. For now, investor anticipation has created a neutral sentiment in the index's recent movements as it approaches the 42,500-point resistance, and these upcoming events are likely to provide deeper insight into the market’s direction in the coming sessions.
Possible Bullish Channel
Since early April, the Dow Jones has shown consistent buying movements, attempting to maintain a potential bullish channel. So far, there have been no signs of significant bearish corrections in the price, which suggests that the current bullish pattern remains the dominant structure to monitor in the short term. However, a strong selling correction could put this trend at risk.
Neutrality Intensifies:
MACD: The MACD histogram continues to hover around the zero line, reflecting a sustained equilibrium in the momentum of the moving averages. This highlights a lack of clear direction in the market over the short term.
ADX: The ADX line remains below the 20 level, indicating that volatility is low, a condition not seen since February of this year.
Both indicators point to persistent neutrality, likely driven by market indecision ahead of key fundamental events, as well as the technical resistance zone, which is currently limiting price advances.
Key Levels to Watch:
42,500 points: Current resistance level aligned with the 200-period moving average. It may act as a potential point for bearish corrections.
43,800 points: A distant resistance level not seen since February. If the price rallies to this level, it could reinforce the current bullish formation and strengthen the prevailing upward channel.
41,100 points: A key support aligned with the 50-period moving average. A drop near this level could jeopardize the bullish formation and potentially shift momentum toward a bearish bias.
Written by Julian Pineda, CFA – Market Analyst
US30 trade ideas

Us30 sell Key Elements:
Price: 41,579.16 (at the time of the screenshot), showing a drop of -343.51 points (-0.82%).
Zones:
Weekly FVG (Fair Value Gap): Around 42,750–43,000.
Daily FVG: Around 42,100.
Daily High/Low: Marked around 42,095.82 (high) and 41,147.61 (low).
Market Structure:
CHoCH (Change of Character): Several CHoCHs marked, indicating shifts in market sentiment and structure.
BOS (Break of Structure): Indicates previous bullish momentum was broken.
---
Prediction Path (Orange Arrow):
Suggests a possible retracement upward into the Daily FVG zone (~42,000+), then a reversal downward, breaking the Daily Low (~41,147).
Final target seems to be near 40,500 or lower, with another CHoCH noted at that level—implying further bearish continuation potential.
---
Interpretation:
The chart suggests a bearish bias:
Retracement to fill the Daily FVG.
Then continuation downward, breaking key structural levels.


US30 BULLISH BIAS RIGHT NOW| LONG
US30 SIGNAL
Trade Direction: long
Entry Level: 41,822.1
Target Level: 42,718.6
Stop Loss: 41,224.4
RISK PROFILE
Risk level: medium
Suggested risk: 1%
Timeframe: 9h
Disclosure: I am part of Trade Nation's Influencer program and receive a monthly fee for using their TradingView charts in my analysis.
✅LIKE AND COMMENT MY IDEAS✅

US30 H1 | Bullish Bounce Based on the H1 chart analysis, the price is falling toward our buy entry level at 42098.02, a pullback support that aligns with the 61.8% Fibonacci retracement.
Our take profit is set at 42539.90, a pullback resistance that aligns with the 78.6% Fibonacci retracement.
The stop loss is placed at 41774.23, a pullback support.
High Risk Investment Warning
Trading Forex/CFDs on margin carries a high level of risk and may not be suitable for all investors. Leverage can work against you.
Stratos Markets Limited (tradu.com ):
CFDs are complex instruments and come with a high risk of losing money rapidly due to leverage. 63% of retail investor accounts lose money when trading CFDs with this provider. You should consider whether you understand how CFDs work and whether you can afford to take the high risk of losing your money.
Stratos Europe Ltd (tradu.com ):
CFDs are complex instruments and come with a high risk of losing money rapidly due to leverage. 63% of retail investor accounts lose money when trading CFDs with this provider. You should consider whether you understand how CFDs work and whether you can afford to take the high risk of losing your money.
Stratos Global LLC (tradu.com ):
Losses can exceed deposits.
Please be advised that the information presented on TradingView is provided to Tradu (‘Company’, ‘we’) by a third-party provider (‘TFA Global Pte Ltd’). Please be reminded that you are solely responsible for the trading decisions on your account. There is a very high degree of risk involved in trading. Any information and/or content is intended entirely for research, educational and informational purposes only and does not constitute investment or consultation advice or investment strategy. The information is not tailored to the investment needs of any specific person and therefore does not involve a consideration of any of the investment objectives, financial situation or needs of any viewer that may receive it. Kindly also note that past performance is not a reliable indicator of future results. Actual results may differ materially from those anticipated in forward-looking or past performance statements. We assume no liability as to the accuracy or completeness of any of the information and/or content provided herein and the Company cannot be held responsible for any omission, mistake nor for any loss or damage including without limitation to any loss of profit which may arise from reliance on any information supplied by TFA Global Pte Ltd.
The speaker(s) is neither an employee, agent nor representative of Tradu and is therefore acting independently. The opinions given are their own, constitute general market commentary, and do not constitute the opinion or advice of Tradu or any form of personal or investment advice. Tradu neither endorses nor guarantees offerings of third-party speakers, nor is Tradu responsible for the content, veracity or opinions of third-party speakers, presenters or participants.

USA30 next possible moveMorning traders,I decided to share few I deas in smaller time frame as you can see dj open higher this week soo you need to generate liquidity in to position,am expecting market to pull a bit lower however it's been selling for past hours as you can you meaning it might continue with the trend before that I didn't mention but shown in the chart,make sure you are updated in everything soo that you wont be surprised when you see spikes understand them when the occur ls thank you I wish you all best n profitable week.

Bias: Short-Term Bullish, Medium-Term BearishReasons:
1. Current Price Action:
Price is within an upward channel and currently trading in the middle-to-upper range.
A recent bullish move broke structure to the upside after a Change of Character (Choch), suggesting bullish short-term momentum.
2. Liquidity Targets:
Price is approaching a Weekly Fair Value Gap (FVG) above current levels. This area can act as a liquidity magnet, encouraging a move up to fill the imbalance before any rejection.
3. Internal FVG (IFVG):
There’s an IFVG where price is currently reacting. This may cause short-term consolidation or a reaction.
If price closes above this IFVG and holds, it could continue to the Weekly FVG.
4. Downside Potential:
After hitting the Weekly FVG, potential distribution or mitigation could occur, leading to a reversal.
The large FVG below (around 41,600–41,200) is a prime target for a deeper retracement or sell-off once liquidity above is swept.
5. Choch Zones:
Previous bearish Choch above suggests prior demand turned supply, reinforcing the likelihood of rejection if price returns there.
---
Trade Considerations:
Bullish Bias until Weekly FVG is tapped.
Switch to Bearish Bias if rejection signs appear after liquidity sweep above the Weekly FVG.
Watch for entry confirmation on lower timeframes near IFVG or Weekly FVG zones.

US30 Is Going Down! Sell!
Here is our detailed technical review for US30.
Time Frame: 9h
Current Trend: Bearish
Sentiment: Overbought (based on 7-period RSI)
Forecast: Bearish
The market is approaching a significant resistance area 41,575.9.
Due to the fact that we see a positive bearish reaction from the underlined area, I strongly believe that sellers will manage to push the price all the way down to 40,381.8 level.
P.S
We determine oversold/overbought condition with RSI indicator.
When it drops below 30 - the market is considered to be oversold.
When it bounces above 70 - the market is considered to be overbought.
Disclosure: I am part of Trade Nation's Influencer program and receive a monthly fee for using their TradingView charts in my analysis.
Like and subscribe and comment my ideas if you enjoy them!

US30: Next Move Is Up! Long!
My dear friends,
Today we will analyse US30 together☺️
The market is at an inflection zone and price has now reached an area around 42,126.0 where previous reversals or breakouts have occurred.And a price reaction that we are seeing on multiple timeframes here could signal the next move up so we can enter on confirmation, and target the next key level of 42,199.7.Stop-loss is recommended beyond the inflection zone.
❤️Sending you lots of Love and Hugs❤️


[Scalping] US30 Short (May 26, 2025)Entry was 42003.9
TP is 41967.8
SL is 42022.04
RR is 1:1.5-2
This is just record purpose with new method to trade.
Please allow this test period.
**I use only session indicator.
Other than that I do not use any indicators
New method can be used only for manual trading.

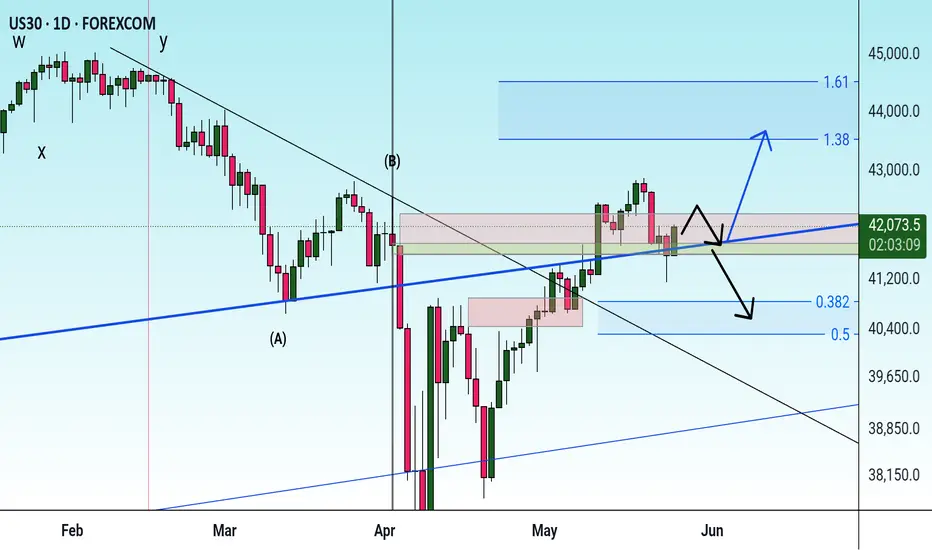
Dow Jonas - Elliot wave📉 DJI — Elliott Wave Top in Sight?
🔍 A long-term analysis with serious implications...
I've been diving deep into the Dow Jones Industrial Average (DJI), using Elliott Wave principles — and what I see may signal the end of one of the longest bull markets in history.
Elliott was right — the massive bull cycle did arrive and extended well into the 2000s. But now, that journey looks to be nearing its final destination.
Currently, I believe we're witnessing the development of an Ending Diagonal pattern — a structure often seen at the end of a major impulse. This formation appears to be completing a set of blue sub-waves, which in turn cap off the larger green primary impulse wave.
📍 The box marks my anticipated top for the DJI. From this point, I expect a strong reversal and the beginning of a major correction.
Now here's the shocking part:
If this correction plays out in time and reaches the Fibonacci 0.382 level, that would suggest a retracement spanning up to 86 years — yes, 86 years.
This isn’t just about markets anymore — such a scenario could carry massive consequences for the global economy and society as a whole.
If, however, we see a strong breakout above the box, then the ending diagonal thesis would be invalidated, and we might instead be witnessing an extended wave 5 — complete with five internal sub-waves.
But either way — the top is coming. It’s just a matter of when, and how hard we fall.
💬 What are your thoughts? Could we really be on the edge of a generational peak?

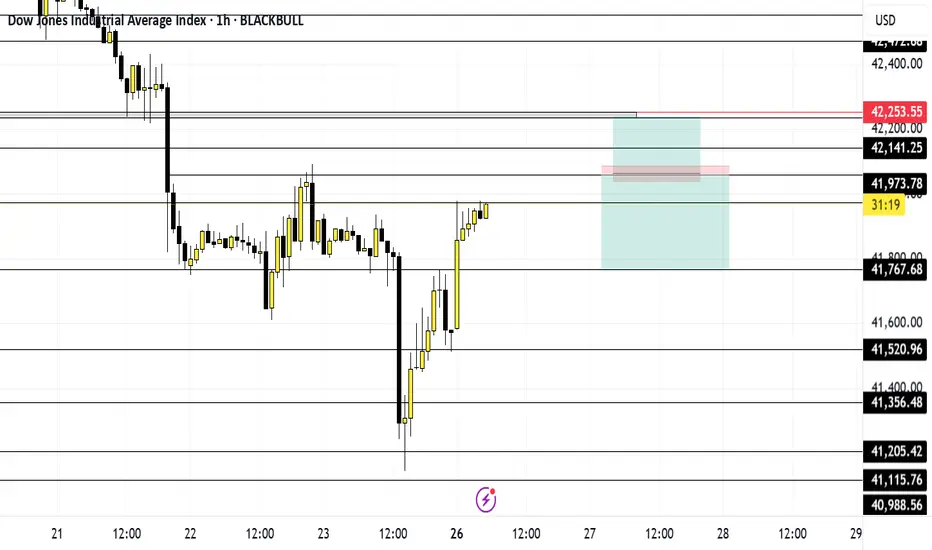
US30 | Supply Strike & Fade Incoming?🧠 Market Context & Bias:
The 30-minute view gives a much broader picture:
Price tapped deeply into the supply zone at 42,056–42,094 and immediately showed signs of strong rejection.
Aggressive sell delta clusters (e.g., -35, -37, -17) right at the supply edge show that sellers absorbed buying attempts and started driving price lower.
The failure to hold above 42,056 is a major clue — it was retested and rejected again, confirming it as resistance.
We're now trading under both the supply zone and minor resistance, with price making lower highs and selling pressure increasing.
🧲 What's Likely Next?
If this rejection holds, momentum favors the downside:
🎯 Targets:
First: 42,020 — minor structure support
Then: 41,960 — demand zone start
Finally: 41,910 — major magnet zone
Watch for acceptance below 42,030 for confirmation.

US30 - At Resistance? Holds or not??#US30 #DOWJONES - market just reached near to his current resistance region.
And if market hold it in that case we can expect a drop from here.
So don't be lazy here and only short below that.
Note: we will go for cut n reverse above region on confirmation.
Good luck
Trade wisely

Hanzo / US30 15m Path ( Confirmed Breakout Zones )🆚 US30
The Path of Precision – Hanzo’s Market tactics
🔥 Key Levels & Breakout Strategy – 15M TF
☄️ Bullish Setup After Break Out – 42100 Zone
Price must break liquidity with high volume to confirm the move.
☄️ Bearish Setup After Break Out – 41920 Zone
Price must break liquidity with high volume to confirm the move.
🩸 15M Time Frame Confluence
————
CHoCH & Liquidity Grab @ 41540
Key Level / Equal lows Formation - 41900
Strong Rejection from 42100 – The Ultimate Pivot
Strong Rejection from 41180 – The Ultimate Pivot
🔥 1H Time Frame Confirmation
Twin Wicks @ 42100 – Liquidity Engineered
Twin Wicks @ 41750 – Liquidity Engineered
Hanzo / Gold 15m Path ( Confirmed Breakout Zones )

May 26 US30Let's get to work... Price at the moment is trending down, creating lower highs and lower lows on the 4hr. However it broke structure on the 1hr and is trending upward.
I'm going to wait for price to get to 42,055 level and wait for it to break and retest for a buy or break structure for a sell.
Caution. Monday is a holiday so I most likely won't trade until Tuesday.
And ultimately whichever way price goes I'm going to get out at my net key level.
Have fun, stay safe and enjoy your journey
"US30/DJI" Index Market Bullish Robbery (Swing Trade Plan)🌟Hi! Hola! Ola! Bonjour! Hallo! Marhaba!🌟
Dear Money Makers & Robbers, 🤑 💰💸✈️
Based on 🔥Thief Trading style technical and fundamental analysis🔥, here is our master plan to heist the "US30/DJI" Index Market Heist. Please adhere to the strategy I've outlined in the chart, which emphasizes long entry. Our aim is to escape near the high-risk YELLOW MA Zone. It's a Risky level, overbought market, consolidation, trend reversal, trap at the level where traders and bearish robbers are stronger. 🏆💸"Take profit and treat yourself, traders. You deserve it!💪🏆🎉
Entry 📈 : "The vault is wide open! Swipe the Bullish loot at any price - the heist is on!
however I advise to Place buy limit orders within a 15 or 30 minute timeframe most recent or swing, low or high level. I Highly recommended you to put alert in your chart.
Stop Loss 🛑:
Thief SL placed at the Nearest / Swing low level Using the 3H timeframe (39200) Day/Swing trade basis.
SL is based on your risk of the trade, lot size and how many multiple orders you have to take.
🏴☠️Target 🎯: 42400
💰💵💸"US30/DJI" Index Money Heist Plan is currently experiencing a bullishness,., driven by several key factors. .☝☝☝
📰🗞️Get & Read the Fundamental, Macro Economics, COT Report, Geopolitical and News Analysis, Sentimental Outlook, Intermarket Analysis, Index-Specific Analysis, Future trend targets with Overall outlook score... go ahead to check 👉👉👉🔗🔗🌎🌏🗺
⚠️Trading Alert : News Releases and Position Management 📰🗞️🚫🚏
As a reminder, news releases can have a significant impact on market prices and volatility. To minimize potential losses and protect your running positions,
we recommend the following:
Avoid taking new trades during news releases
Use trailing stop-loss orders to protect your running positions and lock in profits
💖Supporting our robbery plan 💥Hit the Boost Button💥 will enable us to effortlessly make and steal money 💰💵. Boost the strength of our robbery team. Every day in this market make money with ease by using the Thief Trading Style.🏆💪🤝❤️🎉🚀
I'll see you soon with another heist plan, so stay tuned 🤑🐱👤🤗🤩


Dow Jones breakdown or setup for 15 percent rally?The Dow looks weak but this might be the setup traders dream of. We break down two possible bullish patterns forming — an inverse head and shoulders and an ascending triangle — and explain how Trump’s EU tariffs could shape the next move. Target gains up to 15 percent with risk reward ratios as high as 7.5 to 1.
This content is not directed to residents of the EU or UK. Any opinions, news, research, analyses, prices or other information contained on this website is provided as general market commentary and does not constitute investment advice. ThinkMarkets will not accept liability for any loss or damage including, without limitation, to any loss of profit which may arise directly or indirectly from use of or reliance on such information.

DOW JONES Inverse Head and Shoulders starting new rally.Dow Jones/ US30 has found support today on its 1day MA50 despite the strong correction.
The long term pattern is an Inverse Head and Shoulders and today's 1day MA50 hold may complete its Right Shoulder.
Go long and target the 2.0 Fibonacci extension at 50000.
Follow us, like the idea and leave a comment below!!

Potential downward moveUS30 has been bullish since selling to 36,500 and later retested the lower bound but settled at 37,800. Upon settling above these figures, the indice has been gradually growing, intending to touch the established highs at 42,800 and further up at 45,000. If the price action manages to stabilise above 42,800, the bullish move will still continue until the top.
However, if price fails to settle above 42,800, a bearish correction may be likely, in search of a support structure that will initiate a bullish rise again.
