What’s Driving the S&P 500 Right Now?Observing the S&P 500 at this stage, I believe the key point is not any single headline, but the fragile balance between expectations and reality. The market is no longer reacting strongly to good news, yet it tends to wobble quickly when faced with less favorable signals—classic behavior after a pr
S&P 500 Index
No trades
About S&P 500 Index
Standard & Poor’s 500 is an American stock market index consisting of 500 large companies having common stock listed on the NYSE or NASDAQ and their market capitalizations. It captures approximately 80% coverage of available market capitalization. Because it includes both growth stocks and value stocks it is one of the most followed equity indices and is considered to be one of the best representations of the U.S. stock market and a trend indicator for the U.S. economy. S&P introduced its first index in 1923 and its present day form on March 4,1957. It was developed and continues to maintained by S&P Dow Jones Indices, a joint venture majority owned by McGraw Hill Financial.

SP500 Showing Rejection Pattern what should Next ?S&P 500 showing rejection from the 7,000 psychological resistance zone after a strong bullish rally. Price failed to hold above this level and formed a sharp bearish candle, signalling selling pressure and possible short-term trend exhaustion.
area marks a supply/resistance zone where sellers are a

The Secret Dance of SPX and Emerging MarketsThe Secret Dance of SPX and Emerging Markets
Do you imagine a crystal ball to know when a market will crash or not?
Of course it does not exist, but there are interesting tools to understand when a market could fall.
One of my favorite tools for spotting trouble is the relationship between the

Updated wave structure for the Cash sp 500 Major turn is at hand Under the current wave structure and Fib relationships within the waves We have forming a Major Top The breakdown in IGV is the canary in the coal mine and The 10 and 20 year bonds markets show a breakdown forming The rotation is nearing the end of what I call the g

S&P500 INDEX (US500): Uptrend Continuation
US500 likely completed a correctional movement and will rise soon,
following a confirmed breakout of a resistance line of a bullish flag
pattern on a daily time frame.
Next goal wil be 7050.
❤️Please, support my work with like, thank you!❤️
I am part of Trade Nation's Influencer program and

SPX Daily: Rising Wedge at the HighsPrice is compressing inside a rising wedge near record levels — a downside break would signal a pullback, while an upside breakout requires strong follow-through to sustain the trend.

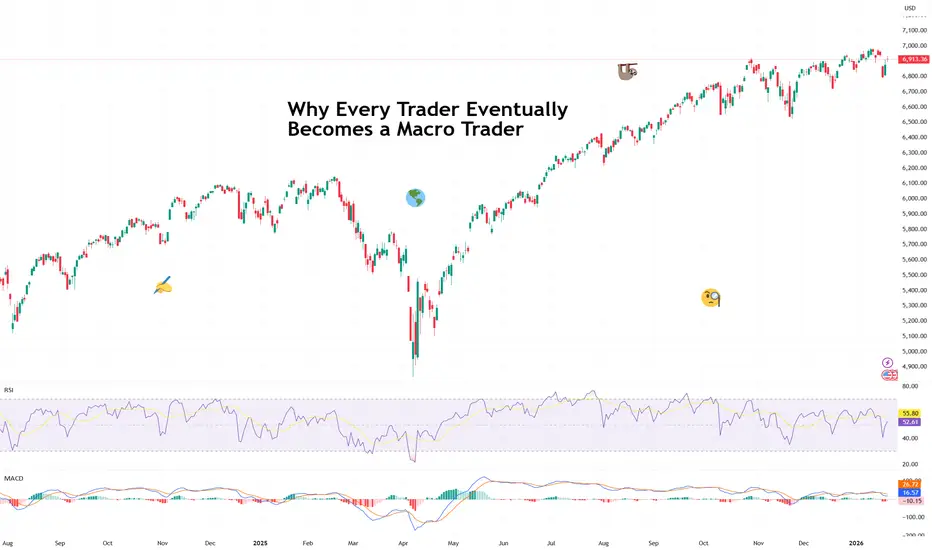
Why Every Trader Eventually Becomes a Macro Trader(And secretly enjoys it.)
Most trading careers begin the same way: a chart, a setup, a belief that price action alone is a complete and self-contained universe. Support, resistance, maybe a moving average or two. Clean. Elegant. Pure.
Macro? That’s for economists, right? Or people who say things
SPY/QQQ Plan Your Trade For 1-29 Update: Wait For ConfirmationThis video should help you understand that I'm not chasing this move (yet).
I still need to see confirmation of this breakdown in terms of volume and Fibonacci price structure.
It looks good so far, but I don't see anything telling me this market move IS going to continue downward. At least based

"Nasty Pattern" Bull Trap; False Breakout Above 7000SPX opened this morning above mythical big number 7000.
What appeared to be a very bullish breakout,
has suddenly turned lower.
What is happening ?
A potential false breakout above 7000.
Now price is in a "descending wedge" pattern moving lower,
and bullish traders who bought the breakout are trap

5-10% Correction for S&P500 incoming SPX is at the 1.618 fib level measured from Jan 25 high and April low.
This fib level acted as a temporary resistance in all major bear Markets (except 2020) with drawdowns between 5 and 10%.
A breach of the 200 DMA and Jan 25 high and April low anchored VWAP is unlikely.

See all ideas
Displays a symbol's value movements over previous years to identify recurring trends.
Frequently Asked Questions
S&P 500 Index reached its highest quote on Jan 28, 2026 — 7,013.7 USD. See more data on the S&P 500 Index chart.
The lowest ever quote of S&P 500 Index is 665.6 USD. It was reached on Mar 6, 2009. See more data on the S&P 500 Index chart.
S&P 500 Index is just a number that lets you track performance of the instruments comprising the index, so you can't invest in it directly. But you can buy S&P 500 Index futures or funds or invest in its components.