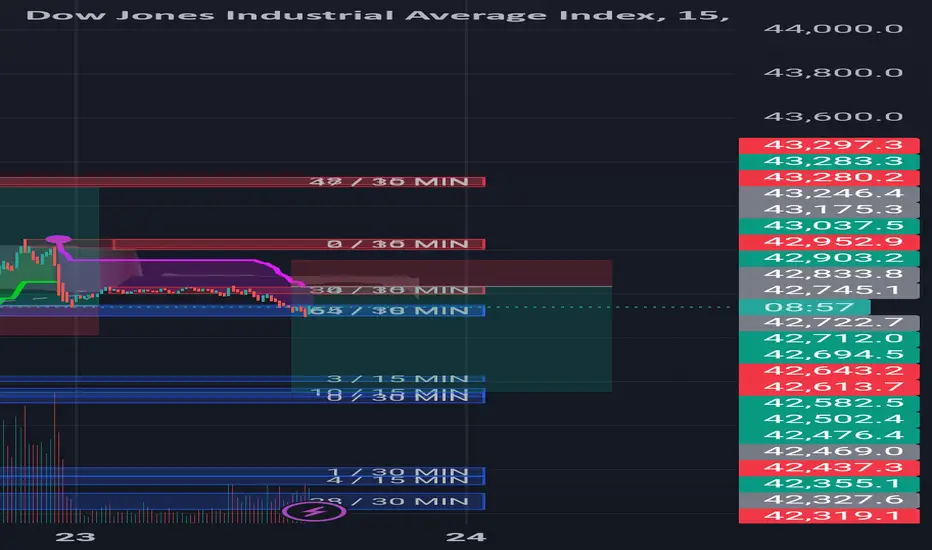
DOW JONES (DJI) Slides Through TP1 & TP2! Eyes Set on TP3 & TP4!Technical Analysis:
On the 15-minute timeframe, the Dow Jones (DJI) short trade has already successfully hit TP1 and TP2, confirming strong downward momentum. Price continues to trade below the Risological dotted trendline, suggesting that the bearish trend is likely to continue.
Key Levels:
Entry: 42,997.92
Stop Loss (SL): 43,161.50
Target 1 (TP1): 42,795.74 (Done)
Target 2 (TP2): 42,468.58 (Done)
Target 3 (TP3): 42,141.42 (Pending)
Target 4 (TP4): 41,939.24 (Pending)
Observations:
After breaking below the Risological dotted trendline, the Dow Jones showed significant selling pressure.
Price continues to respect the downward trendline, supporting the case for further declines toward the remaining targets.
With TP1 and TP2 already hit, the Dow Jones looks primed to move towards TP3 and TP4. Traders should continue to monitor the bearish momentum as the setup points toward more downside potential.
US30 trade ideas

US30 likely bearishThe short-term trend for US30 remains bearish unless there is a strong reversal signal. The indicators (RSI, MACD, and ADX) all point towards continued selling pressure.
The 42220 is a support level. If it breaks, the price could continue towards lower levels. On the upside, a breakout above 42700 would be required to indicate a possible reversal.

The Dow Jones Might Recover From Its LossesAfter the significant price losses, a recovery in the Dow is expected on the last two trading days of this week.
The price target lies between the 38.2% and 50% retracement of the entire downward movement, which is a conservative choice.

Bearish Trend Targets 42,450 Unless 42,910 BreaksUS30 Technical Analysis
The price has dropped by approximately 500 points, reaching the support zone as anticipated in yesterday's analysis.
It has now stabilized below the pivot zone, indicating that the bearish trend is likely to continue, targeting 42,580 and 42,450.
As long as the price remains below 42,770, it is expected to decline further toward 42,450. Conversely, a break above 42,910 would signal a shift to a bullish trend, with the next target at 43,215.
Key Levels:
Pivot Point: 42770
Resistance Levels: 42910, 43050, 43215
Support Levels: 42590, 42450, 42300
Trend Outlook:
- Bearish By stability below 42770
- Bullish by stability above 42910
previous idea:

NEW IDEA FOR DOW By examining the trend in the four-hour time frame, the Dow Jones index has important support in the range of 42365, and now, provided it is maintained, the rate can rise to the resistance of 42978.

DJI Long opportunityIf price will cross above 42532.15 then we can see up move till at least 42935 - 42900 .
price is currently at institutional controlling zone.
Trade at your OWN risk .
I am not SEBI registered .

longLooking at taking buying opportunities at the current price range targeting the HTF swing high price area.

Weekly Forex Outlook Sun.Oct.20.2024 - Fri.Oct.25.2024Like and Comments would be appreciated :D Not Financial Advice, Just my outlook/opinion

Dow Jones Short Term Sell IdeaH4 - Bearish convergence
Currently it looks like a pullback is happening.
H1 - Bearish trend pattern
Currently it looks like a pullback is happening
Until the strong resistance zone holds I expect the price to move lower further after pullbacks.

Are We There Yet?Our top trend line has been touched a few times and rejected now, three days of falls could be the catalyst of the top being in and the early beginnings of a major turn down.
Down days repeatedly see increased volume compared to light volume on up days...usually the market hold up until the Punch & Judy show in November.
They don't ring the bell at the tops, lets watch the next few days, any further heavy selling can take us down to 39,500 area...October surprise?
Appreciate a thumbs up, good trading and God Bless you all!

DOW/US30 - SMALL RISK BIG REWARDTeam, I understand your fear about the down trend,
we been doing very well with the DOW/US30
But today we are going to take a little RISK
entry at 42450-42455
STOP LOSS at 42425
Target 1 at 42515-25
Target 2 AT 42675-76
Note: Once the price hit first target, bring stop loss to BE, dont forget to take 50%-70% partial profit.
This is 3R-5R reward. just play small volume

US30 Breakout Setup – Targeting 43700 and 44000 US30 is showing strong bullish momentum with price holding above an ascending trendline,
I am currently seeing consolidation near a key resistance level if price breaks above 43346 it could signal a good buying opportunity,
I am targeting two main levels for take profit:
First target: 43700 (minor resistance).
Second target: 44000 (psychological level).
My Stop Loss is set just below 43000 to protect the trade, right under the 0.618 Fibonacci retracement and trendline support,
Trade Setup:
Buy Entry: Above 43346 on a confirmed breakout.
Stop Loss: Below 43,000 (protected by the Fib 0.618 level and trendline).
Take Profit 1: 43700
Take Profit 2: 44000
This setup has a strong risk reward profile and follows the ongoing bullish trend in US30, Watch for a strong breakout before entering the trade!
Best of luck!

US30 LONGS-Market is respecting daily tm 4hr, & 30min support
- FVG at 42555 needs to be revisited
-RSI currently at 30
- Expecting lower high to be created by London session or sooner
- Weekly support got hit today


New York Session Recap - US30, GBPUSD, USDCAD [L]Took 3 trades in New York Session - US30 Weekly Trend Reversal, GBPUSD Weekly Trend Breakout, and USDCAD Daily Breakout . I go over what I saw in the market this session.

US30 Nearing 1M Pivot, Decline ExpectedHello,
BLACKBULL:US30 is approaching the 1M pivot point, making it likely to be tested again soon. Currently, the price is expected to decline to the 1M pivot point and possibly lower.
TradeWithTheTrend3344

US30 10/23/24💡
🔍 Daily time frame impulse: Price has made an impulse above the 10/20emas
🔍 Daily time frame correction: Price has corrected into the 10/20emas.
⌛ I will be waiting for the 4hr time frame to make a impulse and show a valid impulse above the 10/20emas as well as a correction into the 10/20emas just like the Daily has showed.
Bias: Bullish

Retest of a highDow Jones might retest a near term as a result of the bearish move. A drop and stability under 43k, will likely see further downward movement.

Dow Jones 30-Minute Trade Targeting Key Liquidity ZoneCurrently, this 30-minute Dow Jones (US30) trade is focused on reaching the liquidity zone around 42,840. The price is trading near previous highs, and a fast move is anticipated from this level. Maintaining a strategic approach, we are closely monitoring this zone to confirm whether a breakout will occur or if the market will reject this liquidity level.
Technicals:
• The market has been ranging near previous highs, indicating a possible buildup of orders around this level.
• The price has shown consistent interaction with the FibCloud, suggesting institutional involvement.
• Current market structure points towards a possible bullish move if the liquidity zone is tapped, followed by a rapid price shift to the upside.
• A key resistance zone lies around 42,840, which will be the short-term target for this trade. If broken, this could lead to higher momentum.
Fundamentals:
• The market remains sensitive to macroeconomic factors such as interest rate updates and geopolitical tensions.
• Positive market sentiment has been bolstered by potential stimulus measures from both the US and international economic policies.
• The US Federal Reserve’s rate hike discussions and global monetary easing are contributing to volatility, impacting the broader market.
• Investor focus remains on earnings season reports and data releases such as the upcoming US jobless claims and inflation figures, which could shift market dynamics quickly.
This setup is poised for a quick move, depending on whether liquidity is tapped, leading to a potential sharp reaction.
Note: Please remember to adjust this trade idea according to your individual trading conditions, including position size, broker-specific price variations, and any relevant external factors. Every trader’s situation is unique, so it’s crucial to tailor your approach to your own risk tolerance and market environment.

US30 Bearish confirmedBearish Bias, Watch for Key Support at 42,469
The market is currently in a bearish phase with strong selling pressure. Immediate support lies around 42,469 - 42,500, and a break below this could lead to further downside.
A reversal could only occur if the price holds this support zone and gains bullish momentum with a move back above 43,037.

Stock market still in expansion phaseStepping back to longer timeframes, it's often easier to see the forest from the trees. It's easier to see patterns. For instance, you can see the rising RSI pattern that follows a long time-frame bull run. When the market starts substantial pullbacks, it breaks that trend to the downside and starts a new trend. That switch results in a recession and a longer timeframe cooling of the market. Currently, it seems we have not reached that point. That is not to say we could not quickly fall into that pattern, but understanding where we are at in a cycle is as import as the decisions we make when the market changes.

US30 Possibly bearish If the price consolidates above 43,150, it could move toward the 43,900 range. However, if it drops below 42,700, we might see a retracement toward lower support levels.
My personal bias is bearish from the resistance