8GM trade ideas


A cup of coffee pleaseSo far, GM has carved a "cup of coffee" pattern with a "handle" being the latter what the price is drawing right now.
On one hand, one could try to take advantage of it by buying the stock in the lower trendline of the channel and selling it in the upper line (1). On the other hand, one could wait for the price to close above the channel and target the projection of it once broken (2).
If we pay attention to the Accum/Dist line, it has been on a bull trend since 2015 and still is. Despite the fact that the indicator hasn't been reliable at all time (august '15 and may '17) is still suggesting on average the stock is still being accumulated and backed by some institutional investors in the long-term.
Do as you wish but everything I said is unworthy if the operation holds a reward/risk ratio below 2 and more importantly, if price closes below 38.19, for it is a master resistence in this stock as I see it.

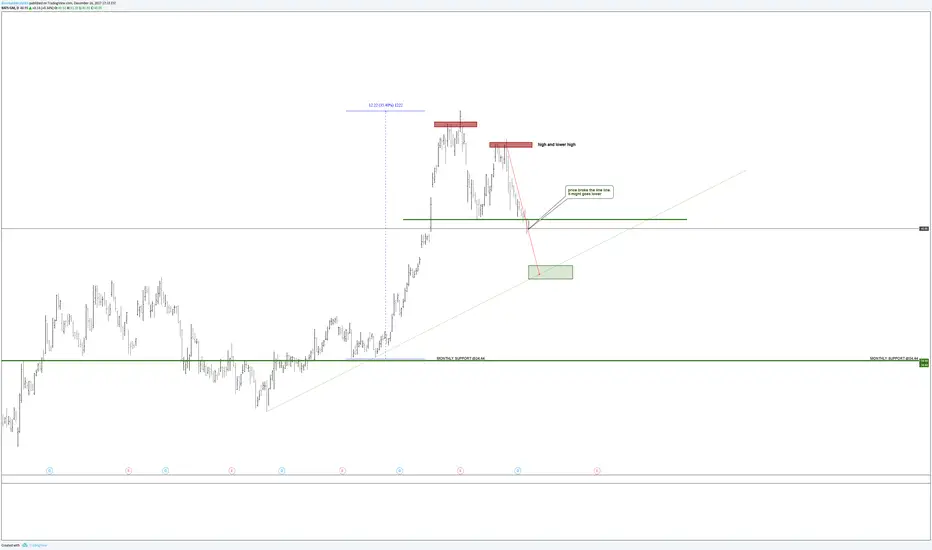
GM's post hurricaine rally could be coming to a haultWhen cars and homes were destroyed, those industries got a boost. LPX makes wood-panel sidings for homes and saw a 15% increase. Auto makers like GM saw a large increase as well this past month. Is it coming to an end for GM? Can it go higher? Is a good entry in sight? I believe so.
The trend angle increased, representing strength, and the price action in terms of ATR increased as well through the uptrend. However, the break through the 41.20 level on news of it's September increase was seen on lower volume than the previous day and ultimately closed below that level.
For me, I take this as a good time to sit on the sidelines and wait to see what happens. If it falls, then I will look for a good entry. Fundamentally, I see this rising over the next quarter.

General Motors, GM, Short Term Bear, RetracementI am not licensed or certified by any individual or institution to give financial advice. I am not a professional Stock trader.
I just published an idea regarding General Motors which covers a slightly different angle of the same idea I'll publish here. I won't go into as much detail with this one. This one is in line format and the other one is in candlestick format to show two different perspectives. I have this in line to show a couple Triple Tops which are a little difficult for me to identify in candlesticks. I see a Head and Shoulder pattern which I have marked with orange arrows; and the Triple Tops I see are marked with red arrows. I didn't want to put too much clutter on here but you can also drawn a down trending line from October 24, 2017 to November 2017 (the 20th, 21st, and 28th are the tops for that month) to January 2018 (the first Triple Top marked with red arrows) to this month (the second Triple Top marked with red arrows). If you need help seeing it let me know and I can publish another chart with just that. For more of a detailed description see my previous post from this same day about GM. Also, to alleviate some confusion I marked the 200 Day Exponential Moving Average (EMA) more clearly in this post. So, to recap, a Head and Shoulder, a Down Trend forming with lower highs since last October, two different Triple Tops, and multiple EMAs forming resistance (covered briefly in my other post, which if I do it right the link will be below; but it's my first time trying that so let me know if it works or not). In my amateur opinion, that is a lot of Bearish signals.

GM Short Term BearI am not licensed or certified by any individual or institution to give financial advice. I am not a professional Stock trader.
I recently published an idea stating I was bullish on General Motors because I saw a rolling pattern. If, after earnings, it continued up I would buy a bullish play. It did, kind of, and I bought a Call option on Friday as I saw the stock price rising. However, as I continued watching GM it was not able to maintain those highs and instead fell on higher volume than the previous day. This was a bearish signal so I sold my Call a couple hours after I had purchased it and took a loss. After looking at General Motors again and realizing the S&P 500 was also unable to maintain a high I purchased a Put option in GM. I have this chart set to candlesticks so you can see the falling price and inability to maintain highs over the past couple days; however, I will also publish a follow up to this in line format because I think it will be easier to see the bearish patterns. I have marked one of the bearish patterns I see, and that is the Head and Shoulder pattern. Another reason I think GM has gone bearish, at least short term, is due to almost all the Exponential Moving Averages (EMAs) being above the closing price; and on top of that (no pun intended) they may also be acting as resistance. The 200 Day EMA is sitting around $40.00ish (I have the EMA line itself orange, and the horizontal support line where it may hit is purple). We'll see if that is enough to catch it or not. I still have the lines drawn showing what I thought was a rolling resistance and support because they still are good lines (in my opinion) and GM may eventually bounce back and forth between them again; only time will tell.
There was a Gap back in September 22-25, 2017 and the Stock used that a support on February 05, 2018. More Bearish signals, to me, are the lower highs from October of 2017 to current; as well as multiple Triple Tops, but I think those are easier to see in line rather than candlestick. The Market as a whole seems to be slightly erratic at the moment so if this doesn't pan out it may be best to just take a step back and until something more definite comes along.

GM Buy into EarningsI believe that General Motors is a strong buy right here. It is in a flag formation and has retraced to the 0.618 Fib level off its most recent move. It has also closed its gap up which was made on the past bullish run. These are all signals pointing to a great GM buying opportunity! With earnings tomorrow it may be smart to hold out until seeing their results, especially if the market is focused on the falling indices. If GM reports good earnings (which I suspect strongly) it may very well go unnoticed. Also the RSI is OVERSOLD! On this awesome american company that trades with only a PE of 8.55 and a Div Yield of 3.84%!
-FYI I am a share holder of GM. This is not financial advice

General Motors Short Term Bull, Roll, ConsolidationI am not licensed or certified by any individual or institution to give financial advice. I am not a professional stock trader.
I believe General Motors is in a rolling/consolidation pattern, at least for the short term. I have two possible support lines drawn. The bottom support line is drawn off the Gap from September 25, 2017 (it's possible to draw a third support line even lower at the beginning of the Gap from September 22, 2017) and the higher support line is drawn off resistance wicks from September 2017 and near the low of December 14, 2017. My Resistance Line at $45.07 is drawn off a lot more points. Throughout October 2017 you can see it acting as old Support, and then in November 2017 it becomes Resistance from the 20th through the 29th, and most recently it was Resistance on January 16, 2018. The orange drawn lines are possibilities of what I think could happen. GM may drop a few more cents and hit the $40.72 line and bounce up, or it could drop to the lower Support of $40.00ish and bounce up. Of course, it could just drop straight through both; but I think it will get a helping hand in rising when the major Indexes reach their 50 Day Moving Average and bounce up after the current retracement is comlete. If, after Earnings is released in a couple days, General Motors hits either of my drawn support lines and begins to rise I will consider entering a Bullish position (either Stock, or Call Option, and maybe paper trade a Bull Put spread for practice).

Calls on GMBased on a Monte Carlo Simulation (based on the last 252 trading days) the stock is trading below its par value of $42.48. I'd expect a downtrend reversal/surprise of 2-3% (historic trend) shortly after the earnings call Tuesday if GM can beat earnings per share expectations for 2017. Additionally, both ARIMA(0,1,0) and ARIMA(5,3,1) models are projecting the stock at 42.2 and 42.5 in 10 days, respectively.
From a fundamental standpoint, here are a few pointers:
GM has consistently maintained profit margins over 5% which is greater than the industry average.
GM's revenue will be lower this year due to slower vehicle sales in North America and due to selling their European operations (OPEL), which is already built into the price at this time
Their efficiency is improving relative to their competitors, especially F and FCAU based on higher inventory turnover ratios
The key metric to watch is GM's earnings per share which could beat expectations this year if GM can maintain sales of higher profit margin products (Trucks and SUV's) and based on the intensity of the share buy-back strategy
Slight chance of an increased dividend yield for GM's stock which I believe to be the driving reason behind the share buy back strategy
Based on how the market opens Monday, I'll be betting with both Feb 16th and March 16th Call options with strikes ranging from 40 - 43, within the resistance range. I may also sell Puts at a $39 Strike, below the resistance level


I'm trading ALDW oil, F, GMViewing the chart above, the vertical line represents the day Hurricane Harvey hit. These stocks; which fall in the automotive, home and oil industries; saw a substantial increase over the next month and all but oil is still seeing an increase.
Ford, GM, LPX and Alon. I have been mentioning and trading the first three, Alon (ALDW) is a new one for me.
ALDW appears to be forming a cup and handle going into this storm. The last storm caused ALDW to jump upward. At a p/e multiple of 16.38, this stock trades cheaper than say XOM, which is at 29.49. Also note that ALDW has a small capitalization of 739 million, making it fairly reactive to oil prices.
I'm using technicals, mainly RSI, for entry. I look for RSI to range around 50-65 on support, lower could mean a bearish move.
My portfolio holdings going through Q4,
FX trading - 10%
Swing/pattern trading - 30%
ALDW - 20%
F - 20%
GM - 20%
