NCB trade ideas
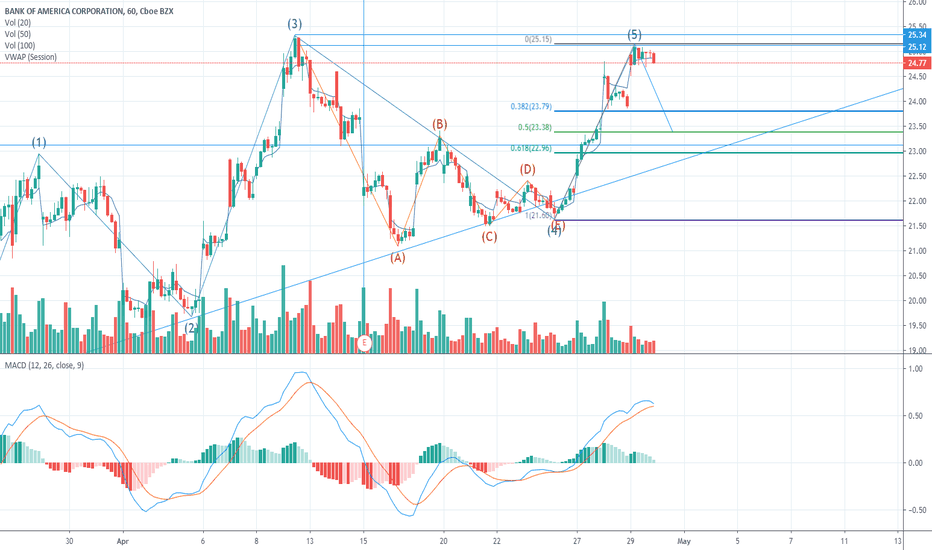
BAC 04.05.20 LongAsset and Time frame -BAC, 1H
Entry Price -22.6385
Exit(Stop Loss) -21.59
Exit(Take Profit) -24.94
RRR is 2.25
Technical Analysis -1H chart is bouncing off the confirmed trend line for the 4th time, price is also "sitting" on the -27.2 level, the price hasn't reached oversold on the 1H chart, and the 4H RSI is bullish.
What can be improved -
Conclusion & End of Trade -
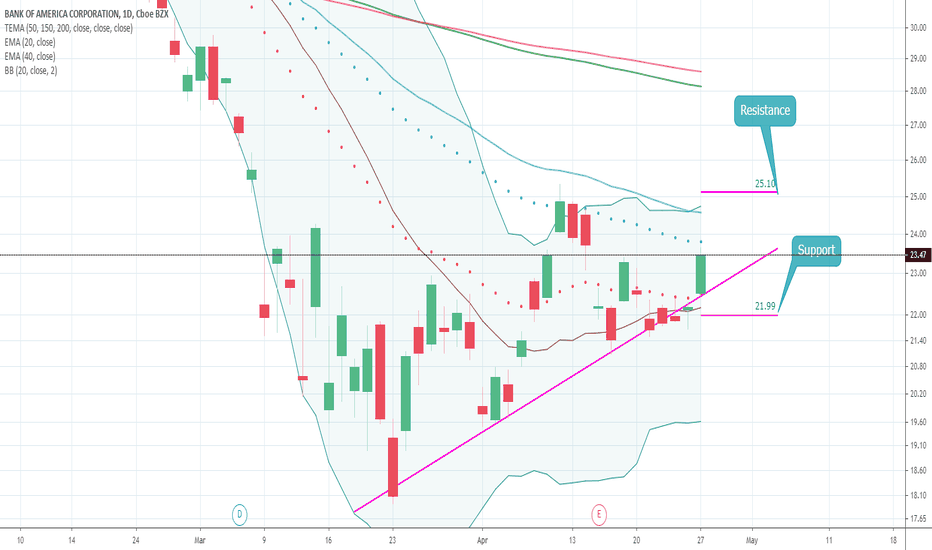
Rising triangle and possible future breakoutBAC forming a triangle. I've been waiting for a good entry for about a week. $22.66 has also been an important line of support in the past. The reward is not super high, but neither is the risk. I'm going to enter now with a stop-loss at $22.45, which is about 2%. I'm hoping to sell some at $25.3 and then either wait for a breakout or buy into the retracement.
Fundamentals look good too. Analysts say that BAC is either buy or hold.
Bank of America bull run last week ending?Technical suggest that a sell off may continue. First, the bearish pennant/symmetrical triangle indicates a sell-off soon. 2nd, double top persistent closure below 38.2% of the bearish impulse move. Third, the 88.6% of the double top shows a bearish hanging man. Thus, the sell-off is imminent.
BAC - Bank of America Corporation - ShortThis stock is currently inside a triangle. It has a very strong resistance, so it might break the triangle and enter in a downtrend until it reaches the support.
This idea is predicting a very similar movement as "Long for TSLA".
Follow me for more ideas and for more profits!
Slippery slope for BACDivergence in BAC. Price is making higher lows but the MFI is making lower lows at the same time. Money is flowing out brother. How? Low volume bump and buy by algos. But how long can it last when real sellers show up?
We can also see a head and shoulders. If the volume picks up and the HS line breaks, I feel this may be a good short. What do you think?
Caveat Emptor and good luck!
BAC AnalysisI expect chart patterns in the current market to be statistically less reliable than in a calm market. For that reason, any trading decisions made solely based on support-resistance, harmonics, Elliot waves, and other technical strategies are relatively useless for traders who operate on holding periods between 1 day and 1 week. The mood changes with each day's news, and it is obvious from looking at the chart since the initial crash that the market is less fearful, but very cautious. Be mindful of the current situation. Those who are polluting the internet with their extreme theories of market direction are to be ignored. The SP500 is not going to zero. It is also not going to make the full V-shaped recovery as quickly as it crashed. We have a long road ahead before any certainty can be derived, and so I am planning my trades with that long road in mind.
In this moment, I am looking for stocks that have overreacted along with the rest of the market, but have yet to really feel the effects that the current state of the world will bring. I think that the financial sector fits that mold, so I am mostly trading banks at the moment. The large banks have been piling on reserves for loan losses, indicated by their collective, extremely low EPS for 1Q20. JPM, BAC, WFC, and others are preparing for the inevitable results of the record-shattering unemployment claims due to COVID-19. Banks will most certainly feel a lot of heat in the coming months. I think that they will have between 6 and 12 months of hardship after the COVID situation is managed or eliminated. Therefore, while bank stocks are in a sort of price consolidation on the charts, their recovery may not yet be upon us. All this is to say that I expect a move toward the YTD low if we don't experience a breakthrough in virus treatment, testing, or immunity in the next few weeks. University seniors will be graduating in the next couple of weeks, entering a job market that is, at the moment, several times worse than what the graduates in 08-09 dealt with. Student debt will continue to pressure many of them, Trump will almost certainly have a second term, the Fed is holding up the market with an unprecedented cost to the public, interest rates will be at virtually zero for at least a year into the future, and an already-struggling retail industry is being crushed.
These are just a few of the factors that I think put a lot of downward pressure on bank stocks. Looking at the chart, BAC is trying to make a decision near the bottom of its channel again, and I don't think it will make a decision before market close today. Monday it could open higher with a bounce off the channel, but that will not signal anything about how it will move through the summer. It seems to be running out of steam on its hard climb up, and I expect that it will move to flatten through this month. If the market's uncertainty causes the stock to move laterally for an extended period of time, it will present opportunities for traders to capture short-term swings. The only thing that can send it higher is control over the virus situation, but I still believe the stock would be defeated at the heavily resistant area from $26 to $29, and that will be the story of it for the rest of the year.
BAC. WILL IT GO LOWER?In stocks there’s about 95% probability that price gaps will be closed. The probability for price closing the gap is more real as you move up in time frames from hourly>daily > weekly. This is a daily chart so it’s high probability. This has never failed me. This is just price analysis, hopefully we can see and buy lower prices. Cheers.
Btw look at previous price gaps and look how they’ve all closed in the future.


