USDOLLAR trade ideas


It’s USD, StupidHey Friends!
It’s the dollar’s move now. The bulls have made their moves on stocks, gold and T-bonds but there is not enough liquidity to go around. Gold prices can only move higher if the stock market or the US dollar surrenders. There is a chance I will be wrong and they win the confidence game, pushing the stock market higher. If they do this there is a real chance that the US dollar will continue higher too.
But for the reasons above, I doubt that what they have decided to do so far will be enough to keep the party going on Wall Street.
Stay ahead of the masses,
Seth Maniscalco
Founder, Crypto Wealth Coach LLC
Owner, Modern Wealth Management LP
www.CryptoWealthCoach.com

Trading plan for the week commencing 4 NOV 2019Friends,
I hope you had a great trading week.
Some of the currencies did not move much last week. For example YEN (-0.22%), CHF (+0.3%), GBP(+0.24%) and EUR (+0.15). That means if you traded these currencies most likely you closed your trade too early as you believed your trades not moving in the direction predicted but the fact is that they did not move at all and it requires time and patience.
But great move by CAD (+1.65%), AUD(+0.82%), USD (-0.74%) and NZD (+0.73%).
All above stats are based on weighted averages on Weekly charts.
Now let’s review the possible scenarios for the coming week.
USD (Bearish)
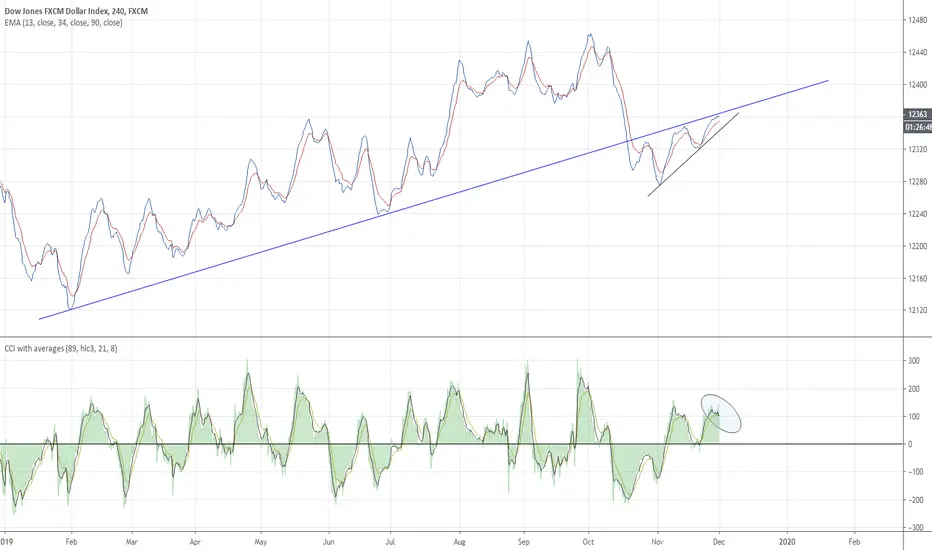
If you remember last week I said USD will be bearish but it has some upside room. This is what has happened during the FED meeting and completed the task after NFP. Indeed USD had 5 losing sessions. For next week I think you can see the target in the chart below
Look at USDOLLAR Weekly. What else you want as a confirmation of a bearish move? Breakout, visiting the breakout area and off the EMAs.
US 10 years Yields has been trading inside a wedge formation and I am in favour of down move as it is below EMAs and Sellers have a target on the lower band of the formation.
EURUSD for the first time broke the falling trend line (Weekly) and pulled back into the breakout area and bounced again and closed nicely higher off the EMAs.
Similarly Cable closed above the falling trend line after almost a year
I bet you love USDCAD chart Weekly. Very clear and transparent breakout, bounce and rejection of the major resistance area
AUDUSD did not quite broke the resistance but with a massive bullish move last week, it adds to the bearish USD scenario.
USDJPY on weekly does not look convincing bearish as Stock made all time highs last week but we had only a negligible +0.13% in USDJPY and see all EMAs above.
Same as NZDUSD weekly as NZD has been depreciating massively over the last a few months and taking this higher needs a lot of efforts from Buyers. We may have Inverted H&S
and every 101 months NZDUSD make a Turn. We are in months 102 right now!
AUD (Bullish)
Last week this Currency highlighted as Bullish, Similarly in the coming week I will remain Bullish however we have very strong resistance on the way up. Any move higher will be limited and profit should be banked sooner for this currency.
Similar to NZD, this currency is ready to break to the topside. See the inverted H&S.
This is what happened last week for AUD (H1)
NZD (Mutual)
Last week I was bearish on this currency and I was wrong. But right now see very strong resistance above it on D1. At the same time on NZDUSD it has a very nice Inverted H&S which suggest a bullish move. Overall I think there might be a change in the sentiment for NZD and it may turn into a bullish market but the question is when? To be honest I do not know and currently I have two positions on this currency over the weekend. NZDUSD Long and NZDCHF Long. First one look fine but I am in lose on NZDCHF.
CHF (Bearish)
Last week I was bearish on this currency and for the coming week I will remain bearish. It is trading below the pitchfork median and EMAs. Until it the resistances are not broken I will remain bearish
EUR (Bullish)
EUR is not going anywhere and if you trade any EUR cross, you should focus on the counterpart as EUR moving slower than a snail. But it is trading above the support as you can see.
GBP (Bullish)
Sterling not going anywhere too but it has a target up there. I think we might have a quick spike to the upside and then it turns lower.
JPY (Bullish)
Yen is not going anywhere too! The fact that Stocks made all time high we should have seen big bearish move on YEN but we did not. Gold moving higher puts pressure on YEN to stay higher and it has a lost of room to go higher. Going lower is more challenging considering the current level of supports below.
If Stocks pulls back next week then USDJPY will be a great Short trade.
Thanks for reading this post.
Have a great weekend.
KHAN

Trading Plan for the week commencing 4 NOV 2019Friends,
I hope you had a great trading week.
Some of the currencies did not move much last week. For example YEN (-0.22%), CHF (+0.3%), GBP(+0.24%) and EUR (+0.15). That means if you traded these currencies most likely you closed your trade too early as you believed your trades not moving in the direction predicted but the fact is that they did not move at all and it requires time and patience.
But great move by CAD (+1.65%), AUD(+0.82%), USD (-0.74%) and NZD (+0.73%).
All above stats are based on weighted averages on Weekly charts.
Now let’s review the possible scenarios for the coming week.
USD (Bearish)
If you remember last week I said USD will be bearish but it has some upside room. This is what has happened during the FED meeting and completed the task after NFP. Indeed USD had 5 losing sessions. For next week I think you can see the target in the chart below
Look at USDOLLAR Weekly. What else you want as a confirmation of a bearish move? Breakout, visiting the breakout area and off the EMAs.
US 10 years Yields has been trading inside a wedge formation and I am in favour of down move as it is below EMAs and Sellers have a target on the lower band of the formation.
EURUSD for the first time broke the falling trend line (Weekly) and pulled back into the breakout area and bounced again and closed nicely higher off the EMAs.
Similarly Cable closed above the falling trend line after almost a year
I bet you love USDCAD chart Weekly. Very clear and transparent breakout, bounce and rejection of the major resistance area
AUDUSD did not quite broke the resistance but with a massive bullish move last week, it adds to the bearish USD scenario.
USDJPY on weekly does not look convincing bearish as Stock made all time highs last week but we had only a negligible +0.13% in USDJPY and see all EMAs above.
Same as NZDUSD weekly as NZD has been depreciating massively over the last a few months and taking this higher needs a lot of efforts from Buyers. We may have Inverted H&S
and every 101 months NZDUSD make a Turn. We are in months 102 right now!
AUD (Bullish)
Last week this Currency highlighted as Bullish, Similarly in the coming week I will remain Bullish however we have very strong resistance on the way up. Any move higher will be limited and profit should be banked sooner for this currency.
Similar to NZD, this currency is ready to break to the topside. See the inverted H&S.
This is what happened last week for AUD (H1)
NZD (Mutual)
Last week I was bearish on this currency and I was wrong. But right now see very strong resistance above it on D1. At the same time on NZDUSD it has a very nice Inverted H&S which suggest a bullish move. Overall I think there might be a change in the sentiment for NZD and it may turn into a bullish market but the question is when? To be honest I do not know and currently I have two positions on this currency over the weekend. NZDUSD Long and NZDCHF Long. First one look fine but I am in lose on NZDCHF.
CHF (Bearish)
Last week I was bearish on this currency and for the coming week I will remain bearish. It is trading below the pitchfork median and EMAs. Until it the resistances are not broken I will remain bearish
EUR (Bullish)
EUR is not going anywhere and if you trade any EUR cross, you should focus on the counterpart as EUR moving slower than a snail. But it is trading above the support as you can see.
GBP (Bullish)
Sterling not going anywhere too but it has a target up there. I think we might have a quick spike to the upside and then it turns lower.
JPY (Bullish)
Yen is not going anywhere too! The fact that Stocks made all time high we should have seen big bearish move on YEN but we did not. Gold moving higher puts pressure on YEN to stay higher and it has a lost of room to go higher. Going lower is more challenging considering the current level of supports below.
If Stocks pulls back next week then USDJPY will be a great Short trade.
Thanks for reading this post.
Have a great weekend.
KHAN