SHORTTTTDollar gives a big short call. With dollar falling buy euro, gold, cable, sell usdjpy , usdcad.
USDOLLAR trade ideas
US Dollar Index Macro View 18/11The US Dollar Index last week are unable to stay above 12260 levels even though there was an increase of consumer prices and retail sales numbers. Ultimately, the Fed policy direction until December are still clear and recent stocks are under pressure for investors to look back into US dollars. The long-term still remains as unchanged constructive for bull, till price stay below 12150 levels going forward. Looking into medium-term still remains unchanged, where the US Dollar Index could continue its way towards 12330 levels progresses. The short-term are suggesting back to sideway might be seen for upcoming week till prices break above 12260 to constructive for bull. Overall, the medium-term bull structure prevails until prices stays below 12100 levels.
Upcoming Thursday is a US thanksgiving day, a US Federal holidays. Wishing all US citizen, a happy holiday.
Disclaimer:
Any opinions, news, research, analyses, prices or other information contained in this content is provided as general market commentary and does not constitute investment advice. ForexBriefcase will not accept liability for any loss or damage including, without limitation, to any loss of profit which may arise directly or indirectly from use of or reliance on such information.

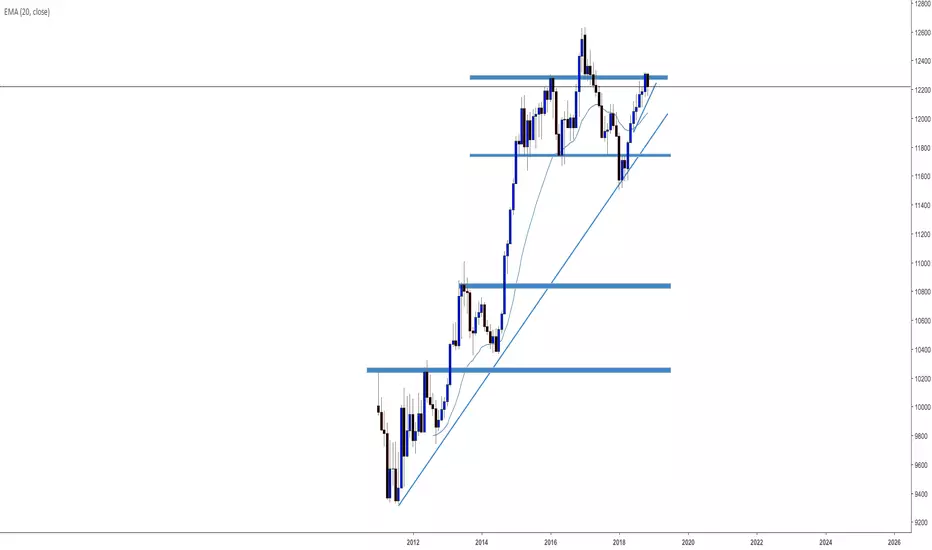
USDOLLAR (19-Nov-2018 until 23-Nov-2018)Monthly Chart:
Still in bullish forming trend.
Weekly Chart:
Looks like forming head and shoulder.
Need to be careful. As it hits around the previous resistance and drop.
Short term for weekly chart is consolidating or bearish.
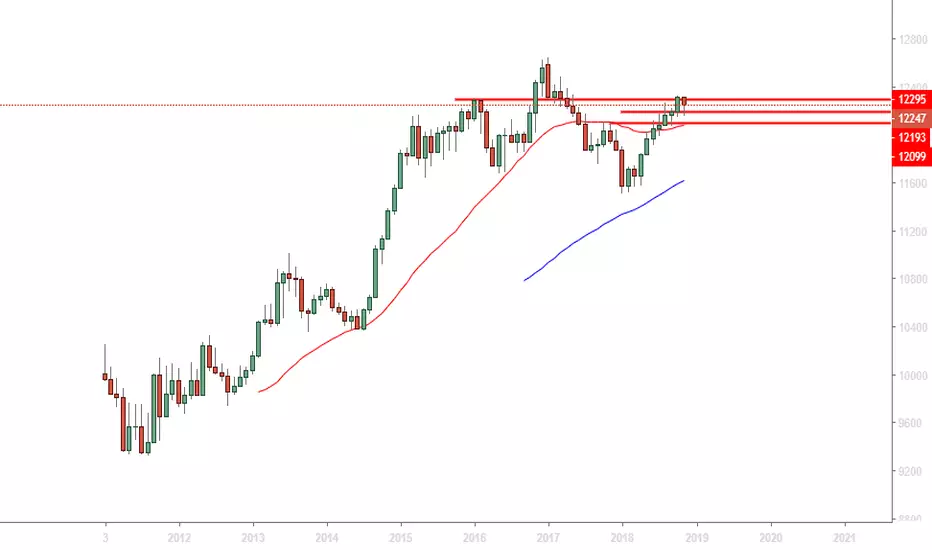
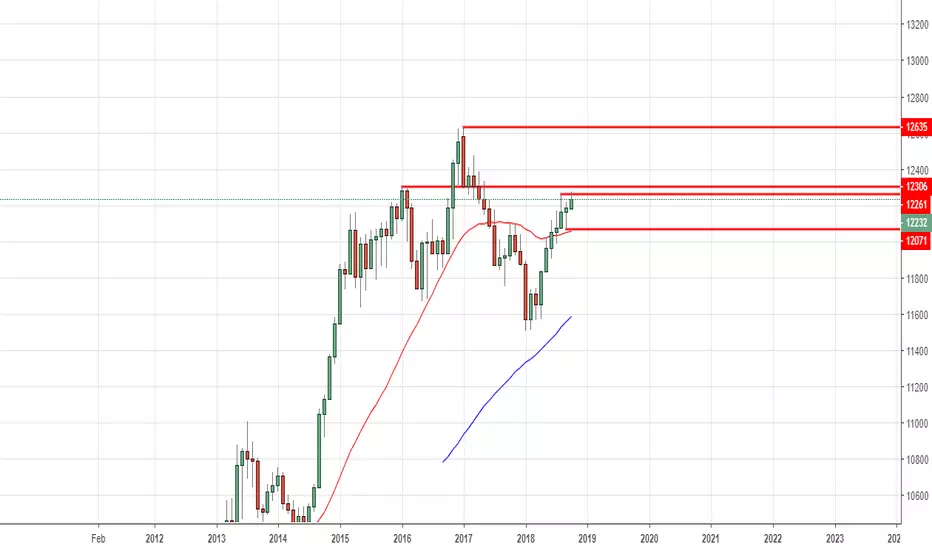
Daily Chart:
Daily chart is getting hit on the resistance.
The bullish is exhausted.
Short term consolidating between 12261 and 12071.
4-Hour Chart:
Trend line for short term broken.
Likely to be bearish for short term.
Lets observe and find a good point to buy and continue the bullish.
Patient is the key to success in trading.
Trade only what you know and not what you don't know.
Trade only regarding the timeline that you are familiar with.
Do not let your emotion or panic affect your trading plan and decision making.

US Dollar Index Weekly PredictionSELF DEVELOPMENT/METHODOLOGY/PSYCHOLOGY
US Dollar Index weekly Prediction
Chart time frame - H4
Timeframe - 1-2 weeks
Actions on -
A – Activating Event
US Dollar Index will see another bull run this week.
B – Beliefs
Market will be rejected at @12276 level however consolidate and then move towards the first Target 1 level @ 12315.
Trade Management
Entered @ Still waiting for confirmation
Stop Loss @
Target @
Risk/Reward @
Happy Trading :)

USDOLLAR (12-11-2018 until 16-11-2018)Monthly Chart
Bullish ongoing.
It is approaching the resistance at the left side.
It might be bullish, might be consolidating, might be building shoulder to go bearish.
Weekly Chart
Hitting resistance and weekly chart might be consolidating or going down to create lower high.
Daily Chart
The lower high has been created, and trend line is hit for a rebound to higher high.
At the same time, the bullish seems to be exhausting and side way or consolidation is expected for next week.
May try to enter for small position to test the market if want to.
4-Hour Chart
Observe if it breaks the left hand side high.
Hourly Chart
Hourly chart is moving higher high.
Decided to trade small position with tight stop loss, test the market.
Will add in more position if the direction is correct.
US Dollar Index Macro View 10/11The US Dollar Index for last week has break down below 12200 levels and came back up again during the season of US Midterm Elections and Federal Reserve’s monetary policy announcement. To no one’s surprise, further gradual increases of interest rates is to be seen in December. The long-term still remains as unchanged constructive for bull, till price stay below 12150 levels going forward. Looking into medium-term still remains unchanged, where the US Dollar Index could continue its way towards 12330 levels progresses. The short-term are suggesting constructive for bull when prices break above 12260 to be seen for upcoming week. Overall, the medium-term bull structure prevails until prices stays below 12100 levels.
As Sunday is a US Veteran Day, Monday will be a US Banks Holiday (Observance of Veterans Day). Wishing all US citizen, a happy holiday.
Disclaimer:
Any opinions, news, research, analyses, prices or other information contained in this content is provided as general market commentary and does not constitute investment advice. ForexBriefcase will not accept liability for any loss or damage including, without limitation, to any loss of profit which may arise directly or indirectly from use of or reliance on such information.

Head and Shoulders in the making?With the recent tumble in US equity markets, will the Fed continue to hike rates? If not, the USD could see some significant weakness...
See callout bubbles. Always measure your risk and be okay with being wrong ; ) Wait patiently and get the price that you want. Use the market. Don't let the market use you.

US Dollar under potential threat as de-dollarization sets in.In this screencast, I'm looking ahead for potential moves, possibly south in the US-Dollar. This is about preparedness.
In the video I explore emerging geopolitical and macroeconomic issues that are taking place.
The US-Dollar strength has big influence at this time on:
1. Commodities
2. Metals - especially Gold and Silver
3. Oil
4. Stock markets in the US and elsewhere.
5. US-Dollar currency pairs.
- and more. This thing is big!
There is reliable information about a silent forex war happening largely unseen as China, Russia and Japan are giving up US debt, and moving into Gold and Crytocurrencies. I don't do predictions, so I'm unable to say what this would mean for the future.
Do not take my word for it - check out this stuff on reliable information channels (unable to give further information here - but PM me if you wish).

US Dollar Index Macro View 3/11The US Dollar Index unable to reach its mark at 12330 levels before strong bear kicks in breaking down strongly through 12260 and found some support at 12200. The long-term still remains as unchanged constructive for bull, till price break below 12200 to 12100 levels going forward. Looking into medium-term still remains unchanged, where the US Dollar Index could continue its way towards 12330 levels progresses. The short-term still remains unchanged, that sideways might be seen for upcoming week. Overall, the medium-term bull structure prevails until prices stays below 12200 levels.
Disclaimer:
Any opinions, news, research, analyses, prices or other information contained in this content is provided as general market commentary and does not constitute investment advice. ForexBriefcase will not accept liability for any loss or damage including, without limitation, to any loss of profit which may arise directly or indirectly from use of or reliance on such information.

What happened to the US Dollar?The US-Dollar got hammered on most pairs in the last day or two. Day traders may have suffered or gained.
The US-Dollar index shows what happened. On the Daily time frame US-Dollar is still pretty bullish, so stay tuned on lower time frames.


US Dollar Index Macro ViewThe US Dollar Index moving back into previous uptrend channel breaking up above 12260 level and has pull back to retest it again. The long-term still remains as unchanged constructive for bull, till price break below 12200 to 12100 levels going forward. Looking into medium-term channel, the US Dollar Index could continue its way towards 12330 levels progresses. The short-term are suggesting that that it losses some strength breaking previous high that sideways might be seen for upcoming week. Overall, the medium-term bull structure prevails until prices stays below 12260 levels.
Disclaimer:
Any opinions, news, research, analyses, prices or other information contained in this content is provided as general market commentary and does not constitute investment advice. ForexBriefcase will not accept liability for any loss or damage including, without limitation, to any loss of profit which may arise directly or indirectly from use of or reliance on such information.

US DollarShort term the break below will help to Buy EURO and break above will lead to sell all dollar pairs, in my openion break above is defficult

US Dollar Index Macro ViewThe US Dollar Index uptrend channel has broken out testing low at 12096 levels and continue up to 12262 levels before pulling back to 12169 levels. The long-term still remains constructive for bull, till price stay below 12096 levels going forward. Looking into the medium-term correction wave, the US Dollar Index could be on its way towards 12096 levels as Wave C progresses. The short-term are suggesting that sideways might be seen for upcoming week. Overall, the medium-term correction structure prevails until prices stay below 12096 levels.
Disclaimer:
Any opinions, news, research, analyses, prices or other information contained in this content is provided as general market commentary and does not constitute investment advice. ForexBriefcase will not accept liability for any loss or damage including, without limitation, to any loss of profit which may arise directly or indirectly from use of or reliance on such information.

USDOLLAR (15-October-2018 until 19-October-2018)Monthly Chart:
Overall chart, bullish is forming and another uptrend is on the way.
Weekly Chart:
Last week was a horrible week. Red week. Bleeding from my pocket.
Looks like the resistance is strong and consolidation at the moment.
Not sure how long it will be, be patient and bear with it.
Daily Chart:
Bullish and in the trend line.
Observe the support zone and entry with stop loss if you're comfortable next week.
4-Hour Chart:
4 hour chart suggest a consolidation is on-going.
Short term trading might be suitable.
1-Hour Chart:
1 hour chart suggest the support level has been touched.
Waiting for it to create lower high and lower high to enter as bullish signal confirmed.
Happy trading.

US DollarDear Friends, Market is not in the position to break 12300, so sell dollar find a best currency pair with dollar, also gold is best to buy at 1200.

USDOLLAR (08-10-2018 until 12-10-2018)Monthly Chart:
Looks going to be bullish.
Weekly Chart:
Bullish also.
Daily Chart:
Seems like consolidating. Overall still bullish.
4Hrs Chart:
Consolidating, where bull rest and will move higher later.
1Hr Chart:
Consolidating, where bull rest and will move higher later.
resistance and 0.886, will usdollar go down?now usdollar reach the important price level,
also there is a bat pattern
short it
thanks

DXY Finding Resistance at PSR?
Hello Traders... DXY, the USDOLLAR Index, this is the bad boy which causes many traders' mystery. It is very important to know what this index is doing if you are to trade the other six majors. USD-JPY seem to have a mind of its own. If DXY is rising, USD-CAD and USD-CHF will also rise with it and EUR-USD, GBP-USD, AUD-USD and NZD-USD will be falling. The opposite happens when DXY is falling. Based on the chart, it looks like the bad boy has found some resistance where he normally finds one. The last time he visited this area, we had a huge move to the down side. If history repeats itself, and sometimes it does, we could see another huge move to the down side, which means we will be looking to short USD-CAD and USD-CHF and buying the other four majors above. I am now waiting for the current resistance, which coincidentally is also being defined by our Fibs as a deep retracement at Fib 23.6, to give a low, then I will insert my trend line. If price closes below that trend line, that could be a confirmation that the move to the down side is underway. I hope this little helps. Happy trading as always. Thank you.

USDOLLAR(Weekly chart). Possible scenario, analysis.USDOLLAR(Weekly chart). Possible scenario, analysis.
Notes on Chart.

USDOLLAR - BreakingUSD appears to be breaking. Look for trades accordingly on your two hour baskets. Lettting daily candle close today.


