Buying ASX at market.ASX200 - 21h expiry - We look to Buy at 7160 (stop at 7120)
Although the bulls are in control, the stalling positive momentum indicates a turnaround is possible.
A lower correction is expected.
The bias is still for higher levels and we look for any dips to be limited.
The 200 day moving average should provide support at 7141.
Preferred trade is to buy on dips.
Our profit targets will be 7275 and 7340
Resistance: 7340 / 7590 / 7800
Support: 7140 / 6965 / 6860
Risk Disclaimer
The trade ideas beyond this page are for informational purposes only and do not constitute investment advice or a solicitation to trade. This information is provided by Signal Centre, a third-party unaffiliated with OANDA, and is intended for general circulation only. OANDA does not guarantee the accuracy of this information and assumes no responsibilities for the information provided by the third party. The information does not take into account the specific investment objectives, financial situation, or particular needs of any particular person. You should take into account your specific investment objectives, financial situation, and particular needs before making a commitment to trade, including seeking advice from an independent financial adviser regarding the suitability of the investment, under a separate engagement, as you deem fit.
You accept that you assume all risks in independently viewing the contents and selecting a chosen strategy.
Where the research is distributed in Singapore to a person who is not an Accredited Investor, Expert Investor or an Institutional Investor, Oanda Asia Pacific Pte Ltd (“OAP“) accepts legal responsibility for the contents of the report to such persons only to the extent required by law. Singapore customers should contact OAP at 6579 8289 for matters arising from, or in connection with, the information/research distributed.
AUS200 trade ideas

Aussie200 2 months Outlook
After a successful uptrend.
Looking around the zone to sell.
Be on a lookout.
Around 6-7% from zone downwards. Likely pressure should come in 1 or 2 weeks.
Switching maybe back to USD or US Equity.
All the best.

ASX200 Bearish Cypher RetracementWe've hit the 786 here on the Bearish Cypher.
ADX has reached extremes and shows the bullish DX cloud beginning to fade out
RSI is showing maturing Bearish divergence as it falls under the moving average and out of the bullish control zone
Id love to see a lower low and lower high locally to confirm the downtrend.
A common retracement to the 382 would bring you to about 7000 and the 618 sits around 6700.

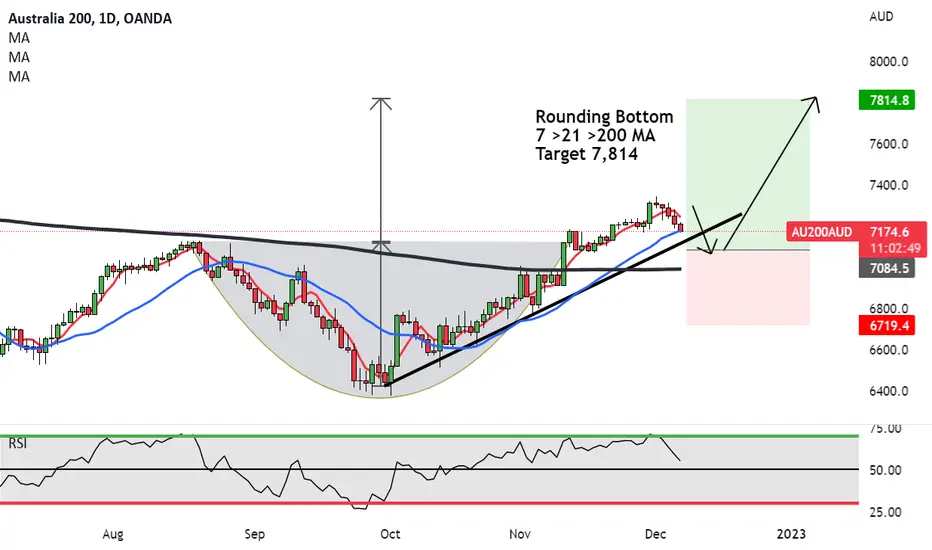
ASX setting for upside to 7,814Rounding Bottom has formed on ASX but the breakout was not strong at all.
I think there'll be a retest to the previous support, which could jolt the price up to a target of 7,814
7 >21 >200 MA looking bullish.
Now we wait
AUS200running trade,, waitting for my traget.. nice trade.. beautiful trade.. volume imbalance , cot. shifting order flow , sequencing..

ASX to find buyers at previous support?ASX200 - 22h expiry - We look to Buy at 7190 (stop at 7140)
3RR
Although the bears are in control, the stalling negative momentum indicates a turnaround is possible.
This is positive for sentiment and the uptrend has potential to return.
The hourly chart technicals suggests further downside before the uptrend returns.
We therefore, prefer to fade into the dip with a tight stop in anticipation of a move back higher.
Our profit targets will be 7340 and 7590
Resistance: 7340 / 7590 / 7800
Support: 7140 / 6965 / 6560
Risk Disclaimer
The trade ideas beyond this page are for informational purposes only and do not constitute investment advice or a solicitation to trade. This information is provided by Signal Centre, a third-party unaffiliated with OANDA, and is intended for general circulation only. OANDA does not guarantee the accuracy of this information and assumes no responsibilities for the information provided by the third party. The information does not take into account the specific investment objectives, financial situation, or particular needs of any particular person. You should take into account your specific investment objectives, financial situation, and particular needs before making a commitment to trade, including seeking advice from an independent financial adviser regarding the suitability of the investment, under a separate engagement, as you deem fit.
You accept that you assume all risks in independently viewing the contents and selecting a chosen strategy.
Where the research is distributed in Singapore to a person who is not an Accredited Investor, Expert Investor or an Institutional Investor, Oanda Asia Pacific Pte Ltd (“OAP“) accepts legal responsibility for the contents of the report to such persons only to the extent required by law. Singapore customers should contact OAP at 6579 8289 for matters arising from, or in connection with, the information/research distributed.

Buying AU200 at swing lows.ASX200 - 21h expiry - We look to Buy at 7226 (stop at 7180)
Although the bulls are in control, the stalling positive momentum indicates a turnaround is possible.
This is positive for sentiment and the uptrend has potential to return.
The hourly chart technicals suggests further downside before the uptrend returns.
We look to buy dips.
Our profit targets will be 7335 and 7395
Resistance: 7340 / 7590 / 7655
Support: 7140 / 6965 / 6770
Risk Disclaimer
The trade ideas beyond this page are for informational purposes only and do not constitute investment advice or a solicitation to trade. This information is provided by Signal Centre, a third-party unaffiliated with OANDA, and is intended for general circulation only. OANDA does not guarantee the accuracy of this information and assumes no responsibilities for the information provided by the third party. The information does not take into account the specific investment objectives, financial situation, or particular needs of any particular person. You should take into account your specific investment objectives, financial situation, and particular needs before making a commitment to trade, including seeking advice from an independent financial adviser regarding the suitability of the investment, under a separate engagement, as you deem fit.
You accept that you assume all risks in independently viewing the contents and selecting a chosen strategy.
Where the research is distributed in Singapore to a person who is not an Accredited Investor, Expert Investor or an Institutional Investor, Oanda Asia Pacific Pte Ltd (“OAP“) accepts legal responsibility for the contents of the report to such persons only to the extent required by law. Singapore customers should contact OAP at 6579 8289 for matters arising from, or in connection with, the information/research distributed.

Buying AU200AUD at previous resistance.ASX200 - 22h expiry - We look to Buy at 7270 (stop at 7230)
Although the bulls are in control, the stalling positive momentum indicates a turnaround is possible.
A lower correction is expected.
The medium term bias remains bullish.
We look to buy dips.
Our profit targets will be 7390 and 7590
Resistance: 7340 / 7590 / 7800
Support: 7140 / 6965 / 6860
Risk Disclaimer
The trade ideas beyond this page are for informational purposes only and do not constitute investment advice or a solicitation to trade. This information is provided by Signal Centre, a third-party unaffiliated with OANDA, and is intended for general circulation only. OANDA does not guarantee the accuracy of this information and assumes no responsibilities for the information provided by the third party. The information does not take into account the specific investment objectives, financial situation, or particular needs of any particular person. You should take into account your specific investment objectives, financial situation, and particular needs before making a commitment to trade, including seeking advice from an independent financial adviser regarding the suitability of the investment, under a separate engagement, as you deem fit.
You accept that you assume all risks in independently viewing the contents and selecting a chosen strategy.
Where the research is distributed in Singapore to a person who is not an Accredited Investor, Expert Investor or an Institutional Investor, Oanda Asia Pacific Pte Ltd (“OAP“) accepts legal responsibility for the contents of the report to such persons only to the extent required by law. Singapore customers should contact OAP at 6579 8289 for matters arising from, or in connection with, the information/research distributed.

ASX200 turn around to long term up?Australia economic, is a starting showing positive trends for the long investor. This week the chart looks good, will confirm the positive trend if the good performance continues for all week.

AU200AUD Pitchfork long broken but opportunity not goneHoping that the opportunity has not passed as the 1D pitchfork broke a while ago (not all my criteria were met at that time) but now just awaiting one indicator ( MACD cross on 1M) however, given support has already been retested I thought it might be worth a cheeky go! :D
Three targets:
T01 based on 1W 786 and 1D SR (25%)
T02 based on falling TL on 1D (50%)
T03 based on 1fib and 1W SR (25%)
2% risk with trailing stop only added once 2% clear of entry :)
🤞❤ OANDA:AU200AUD

AUS200It's daily chart coming to pok lvl with bearish pattern Rsi over bought look's like good risky entry with nearly SL GL have a good trade 🪂📉😎

AU200AUDDivergence is occurring, prices might change direction to the bearish direction, lets wait for the breakout below the support line and see what will happen to the prices


Buying ASX at market.ASX200 - 22h expiry - We look to Buy at 7189 (stop at 7149)
We are trading at overbought extremes.
A lower correction is expected.
The bias is still for higher levels and we look for any dips to be limited.
Further upside is expected although we prefer to buy into dips close to the 7200 level.
Our profit targets will be 7294 and 7354
Resistance: 7340 / 7590 / 7800
Support: 7140 / 6965 / 6860
Risk Disclaimer
The trade ideas beyond this page are for informational purposes only and do not constitute investment advice or a solicitation to trade. This information is provided by Signal Centre, a third-party unaffiliated with OANDA, and is intended for general circulation only. OANDA does not guarantee the accuracy of this information and assumes no responsibilities for the information provided by the third party. The information does not take into account the specific investment objectives, financial situation, or particular needs of any particular person. You should take into account your specific investment objectives, financial situation, and particular needs before making a commitment to trade, including seeking advice from an independent financial adviser regarding the suitability of the investment, under a separate engagement, as you deem fit.
You accept that you assume all risks in independently viewing the contents and selecting a chosen strategy.
Where the research is distributed in Singapore to a person who is not an Accredited Investor, Expert Investor or an Institutional Investor, Oanda Asia Pacific Pte Ltd (“OAP“) accepts legal responsibility for the contents of the report to such persons only to the extent required by law. Singapore customers should contact OAP at 6579 8289 for matters arising from, or in connection with, the information/research distributed.

AU200AU SHORTPossible bearish movement of the pair. The price is currently in a trading zone with significant volume , with rejections at the top of the price right at the 55 period EMA , which is essential in my strategy for analysis of possible trend continuations. We also see significant development in the Squeeze momentum indicator and macd histogram monitors, with directionality changes to bearish confirmed. We see the attached ADX indicator entering below the 23 level line (0 point of the MACD histogram), indicating the weakness of the previous move higher as it bounced towards the 55 period EMA , to continue falling as the moves have indicated. previous; along with a possible sell signal pattern coming soon on the MACD lines. There could be a continuation of the downtrend.
If you are going to take my opinion into account, please respect the projection time, this is extremely important. If it is not fulfilled in the foreseen time and it makes a range, it will be better to close the operation in case it is possible.

AU200AU LONGPossible upward movement of the pair. Price is currently in a lower bound trading zone with significant volume making stops and holding rejections at the bottom of the price near the 55 period EMA , essential in my strategy for analysis of potential trend continuations. Indicators like Squeeze Momentum and the MACD histogram have turned bullish after their red valley; accompanied by the loss of bearish strength indicated by the ADX rebounding towards the EMA . The MACD lines would be giving a possible buy signal soon. I think you could go looking for the previous high price zone when you see indications of a bounce move higher on the 4-hour chart. In 1 hour timeframes we see that it has broken the bearish structure, forming higher lows than the previous ones.
If you are going to take my opinion into account, please respect the projection time, this is extremely important. If it is not fulfilled in the foreseen time and makes a range, it will be better to close the operation in case it is possible.

Aus200 bearish 📉 MoveFall from our order block zone (retest).
Previously we heard a strong bullish move, making it way to our old zone and market shows the aggressiveness. Now we wait for market to tap into our poi then bearish move

Buying ASX at previous high.ASX200 - 22h expiry - We look to Buy at 7025 (stop at 6975)
Buying pressure from 6959 resulted in prices rejecting the dip.
Previous resistance level of 7027 broken.
This is positive for sentiment and the uptrend has potential to return.
Further upside is expected although we prefer to buy into dips close to the 7025 level.
Our profit targets will be 7170 and 7340
Resistance: 7140 / 7340 / 7590
Support: 6965 / 6860 / 6770
Disclaimer – Saxo Bank Group.
Please be reminded – you alone are responsible for your trading – both gains and losses. There is a very high degree of risk involved in trading. The technical analysis , like any and all indicators, strategies, columns, articles and other features accessible on/though this site (including those from Signal Centre) are for informational purposes only and should not be construed as investment advice by you. Such technical analysis are believed to be obtained from sources believed to be reliable, but not warrant their respective completeness or accuracy, or warrant any results from the use of the information. Your use of the technical analysis , as would also your use of any and all mentioned indicators, strategies, columns, articles and all other features, is entirely at your own risk and it is your sole responsibility to evaluate the accuracy, completeness and usefulness (including suitability) of the information. You should assess the risk of any trade with your financial adviser and make your own independent decision(s) regarding any tradable products which may be the subject matter of the technical analysis or any of the said indicators, strategies, columns, articles and all other features.
Please also be reminded that if despite the above, any of the said technical analysis (or any of the said indicators, strategies, columns, articles and other features accessible on/through this site) is found to be advisory or a recommendation; and not merely informational in nature, the same is in any event provided with the intention of being for general circulation and availability only. As such it is not intended to and does not form part of any offer or recommendation directed at you specifically, or have any regard to the investment objectives, financial situation or needs of yourself or any other specific person. Before committing to a trade or investment therefore, please seek advice from a financial or other professional adviser regarding the suitability of the product for you and (where available) read the relevant product offer/description documents, including the risk disclosures. If you do not wish to seek such financial advice, please still exercise your mind and consider carefully whether the product is suitable for you because you alone remain responsible for your trading – both gains and losses.

Selling ASX200 at the top.ASX200 - 22h expiry - We look to Sell at 7025 (stop at 7090)
We are trading at overbought extremes.
Previous resistance located at 7028.
A lower correction is expected.
The hourly chart technicals suggests further upside before the downtrend returns.
Preferred trade is to sell into rallies.
Although the anticipated move lower is corrective, it does offer ample risk/reward today.
Our profit targets will be 6845 and 6770
Resistance: 7140 / 7340 / 7590
Support: 6770 / 6580 / 6400
Disclaimer – Saxo Bank Group.
Please be reminded – you alone are responsible for your trading – both gains and losses. There is a very high degree of risk involved in trading. The technical analysis , like any and all indicators, strategies, columns, articles and other features accessible on/though this site (including those from Signal Centre) are for informational purposes only and should not be construed as investment advice by you. Such technical analysis are believed to be obtained from sources believed to be reliable, but not warrant their respective completeness or accuracy, or warrant any results from the use of the information. Your use of the technical analysis , as would also your use of any and all mentioned indicators, strategies, columns, articles and all other features, is entirely at your own risk and it is your sole responsibility to evaluate the accuracy, completeness and usefulness (including suitability) of the information. You should assess the risk of any trade with your financial adviser and make your own independent decision(s) regarding any tradable products which may be the subject matter of the technical analysis or any of the said indicators, strategies, columns, articles and all other features.
Please also be reminded that if despite the above, any of the said technical analysis (or any of the said indicators, strategies, columns, articles and other features accessible on/through this site) is found to be advisory or a recommendation; and not merely informational in nature, the same is in any event provided with the intention of being for general circulation and availability only. As such it is not intended to and does not form part of any offer or recommendation directed at you specifically, or have any regard to the investment objectives, financial situation or needs of yourself or any other specific person. Before committing to a trade or investment therefore, please seek advice from a financial or other professional adviser regarding the suitability of the product for you and (where available) read the relevant product offer/description documents, including the risk disclosures. If you do not wish to seek such financial advice, please still exercise your mind and consider carefully whether the product is suitable for you because you alone remain responsible for your trading – both gains and losses.

Buying AU200 previous resistance.ASX200 - 22h expiry - We look to Buy at 6875 (stop at 6825)
Although the bears are in control, the stalling negative momentum indicates a turnaround is possible.
The current move lower is expected to continue.
The bias is still for higher levels and we look for any dips to be limited.
We therefore, prefer to fade into the dip with a tight stop in anticipation of a move back higher.
Our profit targets will be 7020 and 7140
Resistance: 6965 / 7140 / 7340
Support: 6860 / 6770 / 6685
Disclaimer – Saxo Bank Group.
Please be reminded – you alone are responsible for your trading – both gains and losses. There is a very high degree of risk involved in trading. The technical analysis , like any and all indicators, strategies, columns, articles and other features accessible on/though this site (including those from Signal Centre) are for informational purposes only and should not be construed as investment advice by you. Such technical analysis are believed to be obtained from sources believed to be reliable, but not warrant their respective completeness or accuracy, or warrant any results from the use of the information. Your use of the technical analysis , as would also your use of any and all mentioned indicators, strategies, columns, articles and all other features, is entirely at your own risk and it is your sole responsibility to evaluate the accuracy, completeness and usefulness (including suitability) of the information. You should assess the risk of any trade with your financial adviser and make your own independent decision(s) regarding any tradable products which may be the subject matter of the technical analysis or any of the said indicators, strategies, columns, articles and all other features.
Please also be reminded that if despite the above, any of the said technical analysis (or any of the said indicators, strategies, columns, articles and other features accessible on/through this site) is found to be advisory or a recommendation; and not merely informational in nature, the same is in any event provided with the intention of being for general circulation and availability only. As such it is not intended to and does not form part of any offer or recommendation directed at you specifically, or have any regard to the investment objectives, financial situation or needs of yourself or any other specific person. Before committing to a trade or investment therefore, please seek advice from a financial or other professional adviser regarding the suitability of the product for you and (where available) read the relevant product offer/description documents, including the risk disclosures. If you do not wish to seek such financial advice, please still exercise your mind and consider carefully whether the product is suitable for you because you alone remain responsible for your trading – both gains and losses.

XJO Dead Cat Bounce or ?Just an observation:
Everytime the Australian consumer confidence index has fallen below 80 into severe pessimism the XJO has corrected atleast 30% from peak to trough.
This has been the case the last 4 times over a 40 year period.
Currently XJO has a had a decent correction but not even close to 30%.
Looks highly probable that we are headed down below 80 in the next few months. Suggesting we could be in a dead cat bounce environment on the XJO.
Also noted the 10 month MA has also dipped under the 3O month MA each time and currently sits well above, which suggests possibly another leg down early next year.

AU200AU LONGPossible upward movement of the pair. Price is currently in a lower bound trading zone with significant volume making stops and holding rejections at the bottom of the price near the 55 period EMA , essential in my strategy for analysis of potential trend continuations. Indicators like Squeeze Momentum and the MACD histogram have turned bullish after their red valley; accompanied by the loss of bearish strength indicated by the ADX rebounding towards the EMA . The MACD lines would be giving a possible buy signal soon. I think you could go looking for the previous high price zone when you see indications of a bounce move higher on the 4-hour chart. In 1 hour timeframes we see that it has broken the bearish structure, forming higher lows than the previous ones.
If you are going to take my opinion into account, please respect the projection time, this is extremely important. If it is not fulfilled in the foreseen time and makes a range, it will be better to close the operation in case it is possible.

AU200HELLO GUYS THIS MY IDEA 💡ABOUT AU200 is nice to see strong volume area....
Where is lot of contract accumulated..
I thing that the Seller from this area will be defend this SHORT position..
and when the price come back to this area, strong SELLER will be push down the market again..
DOWNTREND + Support from the past + Strong volume area is my mainly reason for this short trade..
IF you like my work please like share and follow thanks
TURTLE TRADER 🐢
