NASDAQ100 D1After the price had a strong reaction on the OB, now is geeting back to the zone.
I keep a bullish view until the zone is lost. If that happen we could see price to reach lower zones!
USTEC trade ideas

Technical Analysis: Key Levels After 400-Pip DropTechnical Analysis
Yesterday, the price dropped approximately 400 pip and reversed at its support level. Today, the price is expected to test 21,200. A break below this support level (21,200) could extend the bearish trend toward 20,990.
However, if the price stabilizes above 21,200 with a 4-hour candle close, it could push higher toward 21,400. Stability above 21,400 would support a bullish move toward 21,535.
Key Levels:
Pivot Point: 31350
Resistance Levels: 21400, 21535, 21620
Support Levels: 21160, 20990, 20860
Trend Outlook:
Consolidation between 21200 and 21395
Bearish Momentum by stability below 21200

SHORT NAS100Anticipating single weekly range candle liquidity sweep.
plotting 4H timeframe to find possible good entry as moving average on 1H signal bearish outlook

Final Nasdaq analysis for 2024: 31-Dec-2024 Let’s dive into the last Nasdaq market analysis for 2024. Share insights, and potentially spot opportunities for good pips.

NASDAQ so like before still waiting on this to drop i do have 2 P.O.I to but at the bottom, price thats really interestiing for me is 17575 area theres still alot of liquidity at bottom

Bullish Nasdaq & short term correctionIts obvious Nasdaq is Bullish on HTF i.e long term and given good handsome return also. At te same time in Bullish Index or Stocks short term corrections are sharp as well nasty also to elimnate weak hand from position. Here it likely to resume a strongest upside leg (wave5 inside a wave3 of HTF) before a time consuming downside leg wave4. Marked in red color 23.6% Fib level possibly breached to test 38.2% (lesser probability). Prediction or study invalidated below 38.2% Fib level. Conservative entry may be planned on Day closing above 61.8% (in black) as confirmation. SL management as per Fib.

NDQ - Descending Triangle? Or Bull Flag?I see a descending triangle pattern with the next potential support level at 21,161.
Please cast your vote in the comments as to whether you think it's a Descending Triangle, bull flag or something else?
Let me know if you have other thoughts...

Nas100 update Update on this market following the lead of bearish momentum im seeing I can be sure to look for a sell trade if this market where too take buysofe LQ on the 4hr tf marked and shown by the arrow path and the yellow lines for area of selling. lets see how this plays out we still have time im waiting for either spx,nas,us30 or jpn225 or ger40 to show a signal on the 4hr buyside lq take.

The Quest for Market MasteryEssential Reading for Understanding Markets, Behavior, and Decision-Making
Understanding financial markets and human behavior requires more than just technical knowledge - it demands deep insights into psychology, probability, and decision-making. I've curated a selection of groundbreaking books that together provide a comprehensive framework for mastering these interconnected domains.
Let's start with Daniel Kahneman's "Thinking, Fast and Slow," a masterpiece that revolutionized our understanding of human decision-making. Kahneman introduces us to two systems that drive our thinking: the fast, intuitive System 1, and the slow, analytical System 2. This book is essential for anyone looking to understand their own cognitive biases and improve their decision-making process, whether in markets or in life.
Building on these psychological insights, Richard Thaler and Cass Sunstein's "Nudge" explores how choice architecture influences our decisions. Their work demonstrates how subtle changes in how options are presented can significantly impact outcomes - crucial knowledge for both policymakers and investors.
For those interested in the intersection of theory and practice, Nassim Nicholas Taleb's "Incerto" series (including "Fooled by Randomness," "The Black Swan," and "Antifragile") offers profound insights into probability, uncertainty, and risk. Taleb's work challenges conventional wisdom about randomness and helps readers develop more robust mental models for dealing with uncertainty.
Moving to practical market applications, Edward O. Thorp's "A Man for All Markets" provides a fascinating journey from Las Vegas to Wall Street. Thorp, who pioneered quantitative investing, shares valuable lessons about probability, risk management, and the importance of maintaining a mathematical edge in any endeavor.
Gregory Zuckerman's "The Man Who Solved the Market" tells the incredible story of Jim Simons and Renaissance Technologies. This book offers rare insights into how mathematical models and data science revolutionized trading, while also highlighting the importance of assembling exceptional teams and maintaining rigorous discipline.
Finally, George Soros's "The Alchemy of Finance" introduces his theory of reflexivity, challenging traditional economic theories about market equilibrium. His insights about how market participants' perceptions affect market reality remain highly relevant today.
Reading these books in combination offers several key benefits:
A deep understanding of human psychology and decision-making
Practical frameworks for dealing with uncertainty and probability
Real-world applications of theoretical concepts
Insights into different approaches to market analysis
Lessons about risk management and system building
The authors approach markets and decision-making from different angles - psychology, mathematics, philosophy, and practical experience. Together, they provide a rich tapestry of knowledge that can help readers develop more sophisticated mental models for understanding markets and human behavior.
For beginners, I recommend starting with "Thinking, Fast and Slow" to build a psychological foundation, then moving to "Nudge" and the "Incerto" series. More market-focused readers might prefer beginning with Thorp's memoir before diving into the theoretical works.
Remember that understanding markets and behavior is a journey, not a destination. These books don't offer simple formulas for success, but rather frameworks for thinking about complex problems. The real value comes from integrating these different perspectives into your own mental models and decision-making processes.
Whether you're an investor, trader, policy maker, or simply someone interested in understanding how markets and humans interact, these books provide invaluable insights that can help you navigate an increasingly complex world. The time invested in reading and understanding these works will pay dividends far beyond the financial markets.

Nasdaq Intraday Review - Monday 30 Dec 2024I trade Nasdaq exclusively
Trading in GMT time zone
Sharing my post day review and analysis in case it can help you!
Did my analysis at +- 5:30 am GMT (00:30 am EST)
Economic news - None
News - None
Directional bias - BUY, all higher TFs are bullish
Morning analysis:
M TF - Bullish, but long wick starting to appear which indicates the pressure from bears - at time of writing, wick is 7'295 pips
W TF - Potential W neckline identified. On line chart candle closes have managed to stay above upward trend line.
D TF - Price came up to retest the DT (marked with green lines) and failed to successfully break the neckline upwards. Bears stepped in and pushed back down, now (at time of writing) it seems D EMA is acting as dynamic support.
As the day progressed:
Tried a small buy position at the top hand icon, but it turned out to be a fake out and I took a small loss (+- 300 pips).
Confirmations:
1. Market pattern - DB on 30min TF
2. S&R - D EMA seemed to be acing as dynamic support
3. Trend - temporary pink downtrend line broken upwards
4. Fib - DB forming right at D 0.382 fib level
Mental SL placed at the thick pink line i.e. half the height of the DB pattern. As candles started closing below my mental stop, I closed my position at 300 pips loss.
Price was unable to break through the 30min EMA. If Nasdaq is particularly bullish or bearish, price will react to the 30min EMA.
I was wary of this when I entered and so I entered my buy with a small position, ready to scale in if price moved my way.
However, price moved down significantly, tapping the W 0.618 fib level and the D 50 EMA.
Here price started to consolidate and formed a DB on the 15min TF.
Entered a full position size buy at the blue arrow icon - Confirmations:
1. Market pattern - DB on the 15TF, with a strong momentum candle breaking the neckline upwards (marked in turquoise lines)
2. S&R - strong D S&R zone (marked in red highlight on the D chart), from which price has significantly moved at A. and B. This level acted as resistance at A. and support at B. evidencing that this level is strong.
3. Trend - The temporary downtrend line (marked in orange) was broken upwards, indicating that price is no longer respecting this downtrend and is ready to move upwards.
4. Fib - Price wicked down to the W 0.618 fib level and the DB formed just above this level. This indicated that price is not only reacting to this level but also gave a trend reversal signal (DB pattern) at this level.
5. Candlesticks - A red inverted hammer candle formed on the 30min TF, just before the break of the 15min DB. This candle is bullish in nature and shows that bulls have entered the market and tried to push price higher, but bears did not have the strength to push price down significantly past the candle open. Indicates bearish loss of momentum.
Mental SL placed at the thick pink line, placed below the W 0.618 fib level and below the candle wicks sticking out below this fib level.
Price moved up nicely and I closed my position at 1'300 pips at the top blue arrow when price made a reversal pattern on the 15min TF (DT).
YEAR END CLOSING:
After today's nice profit, I decided to close out my trading year and so I wont be trading tomorrow.
This year was my best trading year yet.
I made 72% ROI and I can't help but say how proud I am of the progress I have made.
It's been a long road, but seeing the returns slowly building is very rewarding.
I hope you had a great trading year! And if not, this is a reminder that it is possible. It's extremely hard, but it is possible. Just keep going!
All the best for 2025! :) Hope we make some good $$$$$$$$$$$$$$$ :)
The total move for the day in the direction that I was looking for was 3'118 pips:
I captured 42 % of the total move and looking at the candles, I am happy with that.
Abbreviations:
TF = timeframe
TP = take profit
1H = 1 hour
4H = 4 hour
D = day
W = week
M = month
S&R = support & resistance
H&S = head & shoulders
EMA = exponential moving average
SL = stop loss

Bearish drop?USTEC is reacting off the pivot and could drop to the pullback support level.
Pivot: 21,309.04
1st Support: 20,948.94
1st Resistance: 21,515.22
Risk Warning:
Trading Forex and CFDs carries a high level of risk to your capital and you should only trade with money you can afford to lose. Trading Forex and CFDs may not be suitable for all investors, so please ensure that you fully understand the risks involved and seek independent advice if necessary.
Disclaimer:
The above opinions given constitute general market commentary, and do not constitute the opinion or advice of IC Markets or any form of personal or investment advice.
Any opinions, news, research, analyses, prices, other information, or links to third-party sites contained on this website are provided on an "as-is" basis, are intended only to be informative, is not an advice nor a recommendation, nor research, or a record of our trading prices, or an offer of, or solicitation for a transaction in any financial instrument and thus should not be treated as such. The information provided does not involve any specific investment objectives, financial situation and needs of any specific person who may receive it. Please be aware, that past performance is not a reliable indicator of future performance and/or results. Past Performance or Forward-looking scenarios based upon the reasonable beliefs of the third-party provider are not a guarantee of future performance. Actual results may differ materially from those anticipated in forward-looking or past performance statements. IC Markets makes no representation or warranty and assumes no liability as to the accuracy or completeness of the information provided, nor any loss arising from any investment based on a recommendation, forecast or any information supplied by any third-party.

US100 - Key Levels and Recovery Potential in Focus🚨 US100 Market Update 🚨
Today’s price action on the Nasdaq (US100) is displaying a recovery from a strong bearish impulse earlier in the session. Let’s dive into the chart and key actionable levels:
Key Levels:
Resistance Zones:
Bear Day: $21,380 is a critical resistance level. A breakout above this zone could pave the way toward the Close Day/Week level around $21,500.
Sellers are heavily defending this zone, making it a key battleground for the day.
Support Zones:
Bear Week (Yellow Dashed Line): $21,260 is providing strong intraday support. This level needs to hold for the bullish recovery to sustain.
Day - ATR: $21,120 represents the lower bound for today’s session. Breaching this level could trigger accelerated selling pressure toward $20,960.
Bullish Swing Zone:
The $21,240 region aligns with the start of bullish interest. A confirmed bounce here could lead to upward momentum toward the next resistance levels.
Volume Profile Insights:
High Volume Nodes (HVNs): A significant volume cluster exists between $21,260 and $21,300. This zone is pivotal for determining market direction.
Low Volume Nodes (LVNs): A gap near $21,180 suggests potential for rapid price movement if the price revisits this area.
Market Structure:
The recovery off the lows is showing signs of strength, but resistance at the Bear Day level has yet to be broken.
The Volume Profile reveals a consolidation near the mid-range of $21,300, indicating indecision in the short term.
Strategy Suggestions:
Longs:
Entry above $21,380 with a target of $21,500 and $21,520. Stop-loss near $21,320.
Alternatively, consider buying near $21,240 if bullish momentum resumes.
Shorts:
Entry below $21,260 targeting $21,120 and $20,960. Stop-loss above $21,300.
Scalping Opportunities:
Use the range of $21,260–$21,380 for intraday scalps until a breakout or breakdown occurs.
Final Notes:
Nasdaq is currently range-bound, and key levels like $21,260 (support) and $21,380 (resistance) will dictate the next move. Watch for volume spikes and strong candle closes to confirm any breakout or breakdown scenarios.
🔔 Are you bullish or bearish on Nasdaq? Let me know in the comments!

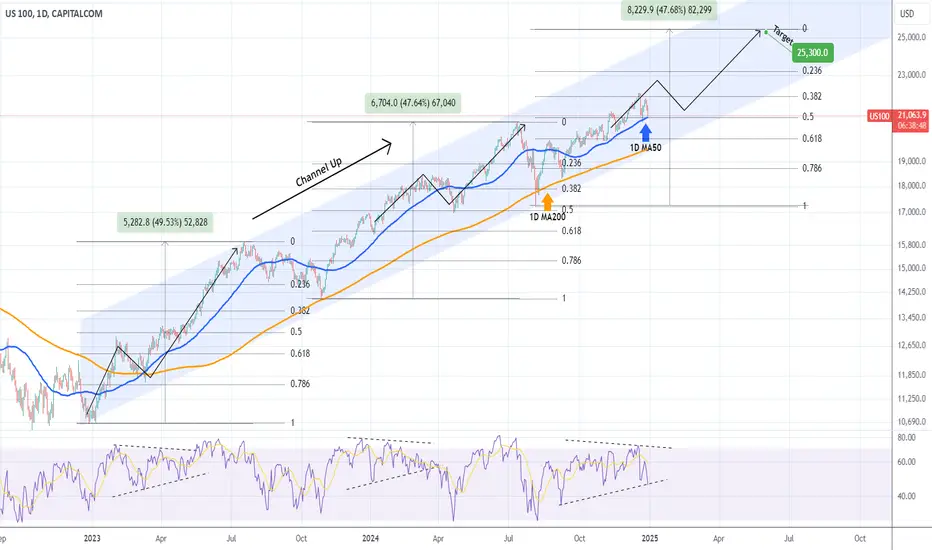
NASDAQ headed into a volatile January but uptrend remains intactNasdaq (NDX) is yet again testing the 1D MA50 (blue trend-line) following the direct hit of December 20. Despite the pull-back, it is technically respecting the 2-year Channel Up that it's been trading in since the December 26 2022 market bottom. Its most recent Higher Low was on the August 05 2024 1W candle, which initiated the Bullish Leg we're currently in.
Until we get a 1W candle closing below the 1D MA200 (orange trend-line), the pattern remains intact and the strategy is to continue buying into the current Bullish Leg. The previous two Bullish Legs had one main pull-back/ correction sequence each and apart from that, the majority of the Leg was technically a straight uptrend. Given that the current Bullish Leg has been trading above its 1D MA50 since September 12, it is not unlikely to see a correction below it.
Technically, it could be similar to the previous Bullish Leg (March 04 - April 15 2024), as we are trading within the 0.382 - 0.5 Fibonacci range. This means that one more rise above the 0.382 Fib is to be expected in the first week of January but it is likely to then see a correction for the rest of the month below the 1D MA50 into the first 2 weeks of February.
If after that, the 0.5 Fib and 1D MA200 levels hold, we expect the Bullish Leg to resume the uptrend and target 25300. That would be a rise of around +48%, which is the % rise of both previous Bullish Legs.
-------------------------------------------------------------------------------
** Please LIKE 👍, FOLLOW ✅, SHARE 🙌 and COMMENT ✍ if you enjoy this idea! Also share your ideas and charts in the comments section below! This is best way to keep it relevant, support us, keep the content here free and allow the idea to reach as many people as possible. **
-------------------------------------------------------------------------------
💸💸💸💸💸💸
👇 👇 👇 👇 👇 👇
"US100 / NASDAQ 100 / US TECH" Indices Market Bullish Heist Plan🌟Hi! Hola! Ola! Bonjour! Hallo!🌟
Dear Money Makers & Robbers, 🤑 💰
Based on 🔥Thief Trading style technical analysis🔥, here is our master plan to heist the "US100 / NASDAQ 500 / US TECH" Indices Market market. Please adhere to the strategy I've outlined in the chart, which emphasizes long entry. Our aim is the high-risk Red Zone. Risky level, overbought market, consolidation, trend reversal, trap at the level where traders and bearish robbers are stronger. 👀 So Be Careful, wealthy and safe trade.💪🏆🎉
Entry 📈 : You can enter a Bull trade at anypoint,
however I advise placing Buy limit orders within a 15 or 30 minute timeframe. Entry from the most recent or closest low or high level should be in retest.
Stop Loss 🛑: Using the 4H period, the recent / nearest low or high level.
Goal 🎯: 22,800.0
Scalpers, take note : only scalp on the Long side. If you have a lot of money, you can go straight away; if not, you can join swing traders and carry out the robbery plan. Use trailing SL to safeguard your money 💰.
Warning⚠️ : Our heist strategy is incompatible with Fundamental Analysis news 📰 🗞️. We'll wreck our plan by smashing the Stop Loss 🚫🚏. Avoid entering the market right after the news release.
Take advantage of the target and get away 🎯 Swing Traders Please reserve the half amount of money and watch for the next dynamic level or order block breakout. Once it is resolved, we can go on to the next new target in our heist plan.
💖Supporting our robbery plan will enable us to effortlessly make and steal money 💰💵 Tell your friends, Colleagues and family to follow, like, and share. Boost the strength of our robbery team. Every day in this market make money with ease by using the Thief Trading Style.🏆💪🤝❤️🎉🚀
I'll see you soon with another heist plan, so stay tuned 🫂

Going for a short!NasDaq already has a bearish trend, Right now there's a bit of consolidation. After my support/resistance line was broken it's an indication letting me know that price wants to continue in a down trend. Hopefully it target's the weekly low on a Monday to set clear sky's for the week!

US100: Correction Complete, Downtrend ResumesIn US100, it seems we have completed a correction in the form of an upward Zigzag. This was followed by a five-wave structure to the downside, signaling a shift back to bearish momentum. I anticipate a brief corrective move upward, likely forming a three-wave structure, before the market continues its decline.
This setup aligns with the broader downtrend, and traders should remain cautious, watching for the correction to complete before considering positions in line with the bearish outlook.

Bearish Momentum with Key Levels: Technical Analysis UpdateTechnical Analysis
The price exhibits bearish momentum as long as it trades below 21,535 and 21,620. This indicates a bearish zone targeting 21,390. A 4-hour or 1-hour candle closing below 21,390 could lead to a further drop toward 21,215.
To confirm a bullish trend, a 4-hour candle must close above 21,630.
Key Levels:
Pivot Point: 21530
Resistance Levels: 21620, 21760, 21900
Support Levels: 21400, 21215, 20990
Trend Outlook:
Consolidation: Between 21,535 and 21,395
Bearish Momentum: Below 21,535 and 21,630

NAS 100: Bullish Trend with Year-End Pullback - Where To Next?In this video, I analyze the NAS 100 on higher timeframes, starting with a quick top-down review to explore a potential trade setup. The three-week and weekly charts indicate a bullish trend; however, as we approach the end of the year, there’s some pullback and uncertain price action. I share my insights on the current market conditions and discuss a possible trade idea. Please note, this is not financial advice.


NAS100 update and buy setupOn our last analysis of NAS100, we were bearish and managed to place sell trades as per our strategy. We are still holding those positions because we are still bearish and we would eventually like to target the 4H low. However, we will be prepping ourselves to take buy positions as per our strategy, while still holding those sell positions. If you want to learn more about how our strategy works, visit our page on X. The link is in the bio.

Actionable Nasdaq insights: 30-Dec-2024Rise and shine, traders! Start your day with actionable Nasdaq insights. Let's grow your skills together, one chart at a time.

NAS 100 NOV 30TH 2025 TARGET ATH 42000.NAS 100 TO 25,000 , DOWN 15000, UP 23500, DOWN 18900, UP 42000
Current rise willl top at 25000-DEC 2024. or slightly below. Deep to 15000- FEB 2025. Rise to 23500--MARCH 2025, drop to 22199- MAY.....Then all time 42000. JUNE-DEC 2025
MARK THOSE LEVELS....Best to buy for generational wealth ......14899. FEB15TH-28TH 2025

POSSIBLE SELL OPPORTUNITY ON NAS100Price showing signs of strong momentum. We look for the pullback to take the trade!
