GBPJPY: Trade Setup/Entrybeeen waiting for this all day.
look for ur confirmation and enter!
let's kill it!
GBPJPY.P trade ideas
GBPJPY short Last week GBPJPY made a new low giving us more clarity on directional bias for. i expect to see a retracement to make a HL to and keep riding the wave..

GBPJPY 1. Basic Structure of the Chart:
This is a 4-hour (4H) chart showing the price movements of GBP/JPY.
There are two Exponential Moving Averages (EMA) on the chart:
The blue line (EMA 50).
The yellow line (EMA 200).
These EMAs are used to identify the trend direction and momentum of the price.
2. Gartley Pattern (Harmonic Patterns):
The chart features a Gartley harmonic pattern, which is formed between the points X, A, B, C, and D.
This pattern predicts a potential price reversal at point D, which is highlighted as a potential target zone.
3. Fibonacci Levels:
The Fibonacci retracement and extension levels (e.g., 0.739, 0.567, and 0.734) are marked on the chart.
These levels help identify possible reversal or continuation zones for the price movement.
4. Potential Price Direction:
A red line is drawn, showing the anticipated bearish movement (price decline) toward point D.
A green zone is also marked, indicating a target area where traders might take profits if the price moves as expected.
The price currently appears to be in a bearish trend, as suggested by the descending triangle pattern and lower highs.
5. Trendlines (Support and Resistance):
The chart has two trendlines:
Resistance line (upper boundary of the triangle), which limits upward price movement.
Support line (lower boundary of the triangle), which holds the price from falling further.
The price is consolidating between these lines, and a breakout below the support is likely.
6. EMA Analysis:
The price is below both the EMA 50 and EMA 200, signaling a bearish continuation.
If the price remains below these EMAs, it indicates that sellers are in control, and the price may decline further.
Conclusion:
This chart suggests a bearish continuation, with a high probability of the price falling toward point D. Pay close attention to the Fibonacci levels, trendlines, and EMA positions to make informed trading decisions.

GBPJPY BUY NOW 📊GBP/JPY Analysis Update: 📊
🔄 Setup: Double Bottom Reversal in Progress
📍Current Price: ¥191.149
🎯 Target Zone: ¥193.073 - ¥194.543
🔒 Stop Loss: ¥189.763
The pair has tested the key support zone and is showing signs of a potential reversal. The formation of a double bottom suggests a bullish move is likely toward the target zones. The descending trendline breakout could act as further confirmation for this uptrend.
Signal Combination Strategy:
Look for bullish confirmation before entry.
Enter around ¥191.150 with stop-loss protection at ¥189.763.
Follow the secure trade rule: Set to break-even once the price hits ¥192.000 to minimize risk.
The Queen Signal highlights reversal zones with high accuracy.
Capitalize on potential gains while staying protected.
💼 Trade with Confidence—Enjoy the Ride! 🚀

gbpjpy buy signal. Don't forget about stop-loss.
Write in the comments all your questions and instruments analysis of which you want to see.
Friends, push the like button, write a comment, and share with your mates - that would be the best THANK YOU.
P.S. I personally will open entry if the price will show it according to my strategy.
Always make your analysis before a trade

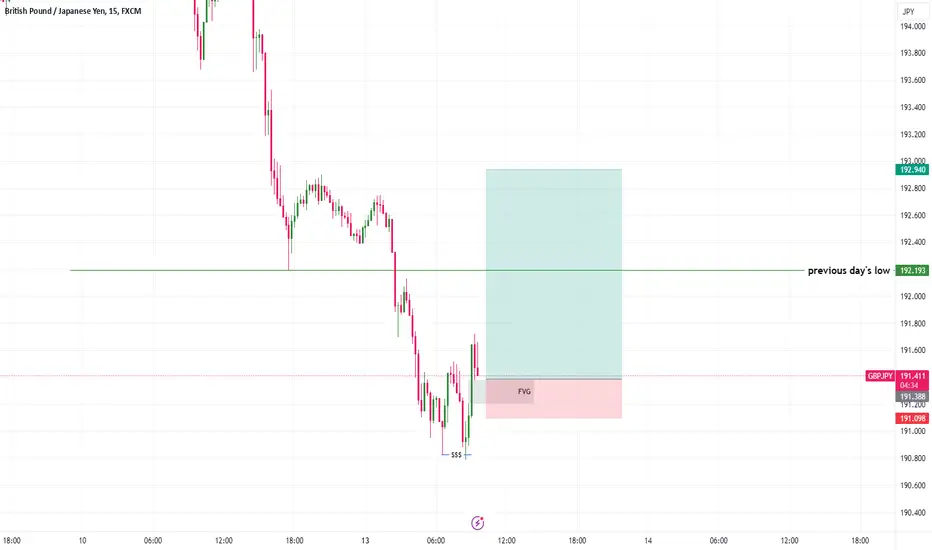
SSL SWEEP GBPJPYAs you can see price reached Fresh Zone Daily and M15. Then, M15 forms Sell side liquidity Sweep (SSL) and makes a market structure shift (MSS). I will enter a long position at BB+FBG zone and target the nearest BSL for the take profit. That’s all and good luck!

downtrendThe price is expected to break through the support trend line. Then, given the price behavior in the specified support zone, it is expected that the downtrend will continue according to the specified paths.

GBP JPY Trade Idea Jan second weekGBP/JPY is currently in an uptrend on the weekly timeframe and is moving towards the liquidity zones around 197.5 and 198.9.
A buy entry has already been triggered, and there is a plan to scale in with another buy entry between the levels of 194.623 and 194.197.
For precise entry, use lower timeframes such as 15 minutes and 5 minutes to identify buy-side opportunities.
This idea is shared purely for educational purposes.

GBPJPY IDEA Expecting price to engineer liquidity and mitigate the 30 mins OB marked out, and then buy. But if market breaks below that OB, a trend change in the daily TF will be confirmed. Then we can begin to look for sell oppurtunities.

GBP/JPYTechnical Analysis: GBP/JPY
This is just a personal opinion.
Be sure to check before entering.
Attention!!!
In these analyses, only technical analysis is considered
So be sure to check the basic news before entering.
Attention!!!
If the trading symbol of the bank is closed, do not trade that symbol!!
Attention!!!
100% does not exist in financial markets
So don't enter this signal hoping for a definite profit

GBPJPY Wedge breakdownGBPJPY on a weekly timeframe has attempted to break above 200$ but has been unsuccessful. Last week a bearish engulfish candle has the bears in charge and weekly moving averages are in a downslope (using 9 sma and 20 sma).
Goal#1 is for GBPJPY to retest 190$ then break through to 185$. I anticipate large moves as the "bear" trend will be developed.
Goal#2 is for GBPJPY to retest support zone at 178$ and then to complete the bear flag breakdown to 171ish.
If I am correct, then the risk to reward is about 1:2.5 which is excellent. Once support breaks below $185, then I will be add shorts to my position. I'm currently risking about 30% of margin for this position.

GBPJPYinstant Buy at fib level 0.618% price retracment.
also fib 0.618% level is support zone
next support 190.674 .
Buy instant 192.460
Stop loss 190.302
Take profit 194.634
RRR 1:1

GBPJPY TRADE SETUPWait for retest the entry level then take a trade for Sell otherwise skip this setup

GBP/JPY - The Massive Opportunity Most Traders Will Miss!Welcome to today’s market analysis with Mr. Blue Ocean FX! It’s Sunday, January 12, and while the markets are closed, we’re diving into a detailed look at GBP/JPY and the huge opportunities it presents.
Key Highlights:
• Starting on the monthly time frame , we’re observing a ranging market , with higher highs and lows suggesting an overall bullish trend. However, signs point to potential lower prices ahead due to key liquidity levels being tested and rejected.
• On the weekly time frame, a double-top formation near the 199 area hints at bearish pressure. Key neckline support sits around 190, which, if broken, could open the path to targets at 173 and 163.
• Scaling down to the daily and H4 time frames, the market is consolidating, and liquidity sweeps or retests of significant levels could offer high-reward trade setups. We’re also watching for rejection at key resistance levels before potential further downside.
• Key Trading Tip: Markets range 75-80% of the time—recognize these opportunities to trade within consolidation zones!
Trade Setup:
• Watching for lower-high formations or liquidity sweeps to confirm entries.
• Stops will be placed above key resistance levels, with potential short-term targets at 190 and longer-term targets at 173 and 163.
Stay disciplined: “Don’t chase the falling knife!” Always wait for pullbacks or retests to maximize risk-to-reward.
If you found this analysis valuable, don’t forget to like, share, and follow! Comment below with pairs you’d like us to analyze in future videos.
Happy trading and see you next time!

GBPJPY OutlookGBPJPY
Yearly
bullish with price trading within last year's VA
Monthly
bullish. looks good now that price has pulled all the way back to last month's VA and POC, ideally warranting an aggressive push north.
Weekly
price has just cleared yearly AVWAP. moved quite aggressively to the down side here even after the news about the rate cuts came in, this weekly candle's VA is right at the qtr POC and PP so even if price is to fall down it should pull back to it.
plan here will be to wait for buyers to step in. maybe it falls down to the LVA below on layout 4.1 and then buyers start to step in.
buyers can step in at the current close price of friday as we have already tagged 2024 POC.
any long position needs to be calibrated in a way that we book around lay 4.2's POC+VA+pp as there is a high probability of a sharp reaction from there.

GBPJPY Inflection Point GBPJPY Trade Idea: Assessing Bearish Continuation or Reversal
Current Analysis:
1. Trend and Moving Averages:
• GBPJPY closed below the 200 SMA on the daily timeframe, indicating bearish momentum.
• The pair has also broken below the Ichimoku Base Line on the daily chart, confirming weakness.
2. Key Fibonacci Level:
• Price recently wicked to the 0.618 retracement level, a significant point of interest.
3. Volume Profile:
• GBPJPY is trading between two High Volume Nodes (HVNs).
• The upper HVN is notably larger, suggesting a strong resistance zone above.
4. Ichimoku Analysis:
• Price is clearly below the 4H Ichimoku Cloud, supporting the bearish bias.
• It has also broken below a 4H bullish order block that formed the recent high a few weeks ago, which is now invalidated.
5. RSI and Momentum:
• The 4H RSI is at 25, signaling an oversold condition. However, oversold conditions often lead to further downside if retail traders begin buying prematurely without divergence.
6. Trendlines:
• A minor descending trendline is connecting the recent 2H highs, which aligns with the broader bearish structure.
7. Extension Levels:
• The price has broken and closed below the 100% extension of the current downward move.
Trade Considerations:
1. Risk-Reward Analysis:
• Long Position:
• Risk: 9% for a potential 12% reward.
• Oversold conditions make this a tempting setup, but the downward trend remains intact, and longs would be counter-trend.
• Short Position:
• Risk: 8% for a potential 21% reward.
• The bearish structure and momentum suggest this is the more favorable setup.
2. Position Sizing and Risk Management:
• Trend Bias: Bearish.
• Total risk is capped at 1% of the account.
• Position size calculated to be 12.5% of the account, ensuring the maximum risk is 1% of total equity.
Trade Plan:
• Short Bias:
• Enter short, risking 8% of the position size.
• Stop Loss: Above the minor trendline and previous HVN (approximately 8% risk).
• Target: Key support levels for a 21% potential gain.
• Wait-and-See Approach:
• Monitor for a potential breakdown to confirm bearish continuation.
• Alternatively, observe for a breakout and lower high (LH) formation, which may signal a reversal opportunity.
Conclusion:
While GBPJPY is at an inflection point with oversold conditions on the 4H timeframe, the trend remains bearish, and the risk-to-reward ratio favors short positions. Retail traders often buy too early at such levels without confirmation, potentially fueling further downside.
Patience is key—wait for a clear breakdown or a breakout with an LH formation before taking action.

GBPJPYAccording to CHOCH BOS Rules
H4 BOS Buy, according to the flow will go up to make a boss (new high)
Daily CHOCH Sell, according to the flow will go down to make a boss (new low)
Entry with confirmation on H1 for execution (can be engulfing / CB1)
Buy below, Sell above.. What do you think?

GBPJPY 1D. Waiting for swing entry setupBeautiful pattern formation. On the D we have a rising wedge crawling to upper area the bearish market structure. Rising wedge usually indicates a breakdown coming

GBP JPY 4 hours timeframe AnalysisEconomies.com provides the latest technical analysis of the GBP/JPY (British Pound Sterling/Yen). You may find the analysis on a daily basis with forecasts for the global daily trend. You may also find live updates around the clock if any major changes occur in the currency pair.

GBPJPYtrend is bearish
AB=CD is complete
print divergence at D point PRZ
Buy stop 190.692
SL:187.930
TP: 193.454

GBPJPYtrend is bearish
AB=CD is complete
print divergence at D point PRZ
Buy stop 191.318
SL:190.032
TP1: 192.862
TP2:194.203

GBPJPYStrategy #1
trend is bearish
AB=CD is complete
print divergence at D point PRZ
Buy stop 191.318
SL:190.032
TP1: 192.862
TP2:194.203

GBPJPYInverted head and shoulder beark neck line
bearish trend line beark
bulish divergence at bottom
Buy at 192.800
SL 189.996
TP:196.142
RRR 1:1
