Buy gbpusdStrong buy expected
More bullish correction
Trend changed
Daily down trend broken and confirmed buy trend continuation
GBPUSD trade ideas

GBPUSD Will Go Up! Long!
Here is our detailed technical review for GBPUSD.
Time Frame: 12h
Current Trend: Bullish
Sentiment: Oversold (based on 7-period RSI)
Forecast: Bullish
The price is testing a key support 1.244.
Current market trend & oversold RSI makes me think that buyers will push the price. I will anticipate a bullish movement at least to 1.261 level.
P.S
The term oversold refers to a condition where an asset has traded lower in price and has the potential for a price bounce.
Overbought refers to market scenarios where the instrument is traded considerably higher than its fair value. Overvaluation is caused by market sentiments when there is positive news.
Like and subscribe and comment my ideas if you enjoy them!

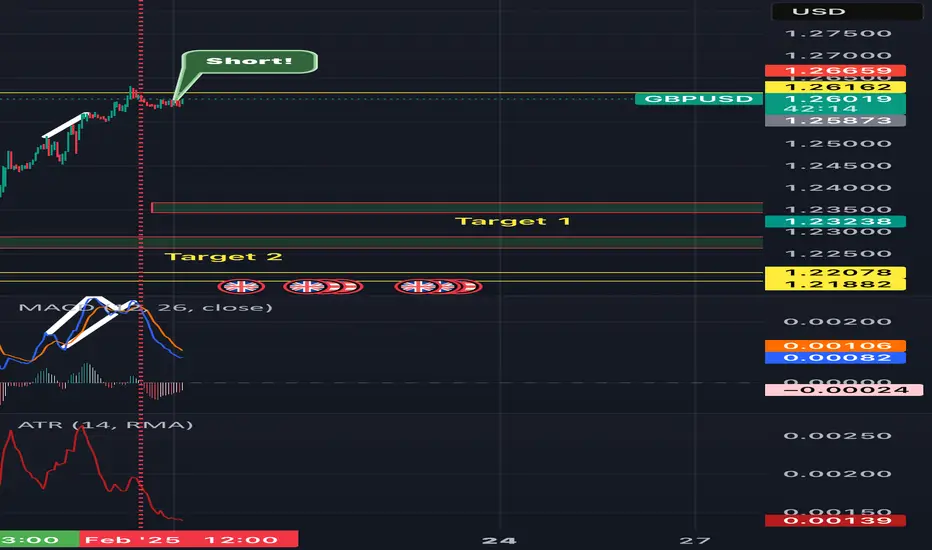
Short buddy!!!My three confluences have been met.
Market exhaustion
Price action
And my macD divergence
Should fell 200 pips this week in my opinion
What are your thoughts?
Trade safely my friends
GBP/USD BEARS ARE GAINING STRENGTH|SHORT
Hello, Friends!
We are now examining the GBP/USD pair and we can see that the pair is going up locally while also being in a uptrend on the 1W TF. But there is also a powerful signal from the BB upper band being nearby, indicating that the pair is overbought so we can go short from the resistance line above and a target at 1.244 level.
✅LIKE AND COMMENT MY IDEAS✅

GBPUSD Buy/Long IdeaGBPUSD is currently in a strong uptrend, and the push to the upside is still in momentum. I believe it will continue to push further up after a small retrace.

GBP/USD Rally: Is 1.28 the Next Target?In my post last week about GBP/USD, I mentioned that as long as the 1.23 support remained intact, the pair could rise toward the 1.26 resistance level and that buying dips below 1.24 could be a good strategy.
Indeed, the pair climbed to 1.26 on Friday, which raises the question—what’s next?
In my view, GBP/USD is likely to continue its ascent, with the next bullish target being the 1.28 resistance zone.
In conclusion, dips around the 1.25 support could present buying opportunities, with invalidation below 1.24 and a target at the 1.28 resistance level.
Disclosure: I am part of Trade Nation's Influencer program and receive a monthly fee for using their TradingView charts in my analyses and educational articles.

#GBPUSD 1DAYGBPUSD (1D Timeframe) Analysis
Market Structure:
The price has broken above the downtrend resistance, indicating a potential shift from bearish to bullish momentum. This breakout suggests that buyers are gaining control, but further confirmation is needed before entering a position.
Forecast:
A buy opportunity may arise after a retest of the broken resistance level, which could now act as support.
Key Levels to Watch:
- Entry Zone: Wait for a retest of the breakout level and confirmation of support before considering a buy position.
- Risk Management:
- Stop Loss: Placed below the retest level or recent swing low to manage risk.
- Take Profit: Target higher resistance levels or key areas for potential upside movement.
Market Sentiment:
The breakout above the downtrend resistance is a sign of potential bullish movement, but patience is needed to ensure the price holds above the retested level before entering a trade.

GBPUSD 02/17-21FX:GBPUSD Retracement created confirmed thru the Keltnrr, need to break the resistance line first before going longs

GBPUSD EXPECTATIONSGBPUSD completed +40pips from my Friday analysis now price made a bounce from the equal previous higher lows am looking forward to see price made a pull back up to 1.26311 then any rejections from there is a sell entry down to 1.23777.....
LETS KNOW YOUR VIEW ON THIS........

GBP/USD Bearish Outlook – Technical & Fundamental ConfluenceGBP/USD remains in a well-defined downtrend, respecting a descending channel and key resistance levels. The pair recently tested the upper boundary of the channel near 1.2609, aligning with the 38.2% Fibonacci retracement level and the 200-day moving average, suggesting strong bearish rejection.
Technical Outlook:
• Price Action: GBP/USD has formed lower highs and lower lows, indicating sustained selling pressure.
• Trendline & Resistance: The pair remains below the long-term descending trendline, with 1.2609 acting as a major resistance zone.
• Indicators:
• RSI: Approaching overbought territory, increasing the likelihood of a reversal.
• MACD: Bearish momentum is building, suggesting potential downside continuation.
• Target Levels:
• Short-term support: 1.2330 – Break below this level could trigger further downside.
• Major target: 1.1835 – A measured move projection based on the channel pattern.
Fundamental Factors:
• BoE Dovish Stance: The Bank of England recently cut rates to 4.5%, citing economic concerns, contrasting with the Federal Reserve’s steady rate policy, which supports USD strength.
• UK Inflation Concerns: Inflation is expected to rise to 2.8% due to VAT increases and higher airfares, potentially complicating BoE’s policy direction.
• US Economic Strength: Strong US economic data, including GDP growth and resilient labor markets, further bolster the USD.
• Geopolitical Uncertainty: Potential US tariffs on UK exports could add additional downside pressure on GBP.
Trade Idea:
• Bias: Bearish
• Entry: Below 1.2330 on confirmed breakdown
• Target: 1.2099, with potential for 1.1835
• Stop-Loss: Above 1.2609 to invalidate the bearish structure
Conclusion:
GBP/USD remains under selling pressure both technically and fundamentally. A confirmed breakdown below 1.2330 could accelerate bearish momentum toward the next key support levels. Traders should watch for price action signals and remain cautious of any unexpected shifts in macroeconomic data.

check the trendIt is expected that the trend will change within the current resistance and time range and we will witness the beginning of a downward trend.
If the price stabilizes above the resistance range, the upward trend will likely continue.

GBPUSD-SELL strategy 6 hourly chartThe pair is overbought, and feel we may see lower levels again. The stochastic and Fisher are negative, so we have some chance for those lower levels to be seen.
Strategy SELL @ 1.2575-1.2610 and take profit near 1.2437.

GBPUSD Weekly BiasI do anticipate that this price might continue with the bullish momentum, targeting buyside liquidity at 1.281. My optimum entry position will be at 1.2552 (with confirmation from a lower time frame)

Fundamental Market Analysis for February 17, 2025 GBPUSDThe GBP/USD pair is trading slightly higher near 1.25850 in the early Asian session on Monday, rising on the back of a positive UK Gross Domestic Product (GDP) report and weak US retail sales data.The US market will be closed on Monday due to the Presidents' Day holiday.US retail sales posted their biggest drop in nearly two years, dragging down the dollar. The Commerce Department's Census Bureau reported on Friday that retail sales fell 0.9 per cent in January after an upwardly revised 0.7 per cent rise in December, which was weaker than the 0.1 per cent decline that had been forecast. On a year-over-year basis, retail sales rose 4.2 per cent during the same reporting period.Stronger than expected UK GDP figures provide some support for the Pound Sterling (GBP). According to the UK Office for National Statistics (ONS), the UK economy grew by 0.1% quarter-on-quarter in the fourth quarter of 2024, beating expectations. Traders will be monitoring the UK labour market and Consumer Price Index (CPI) inflation data, which will be released on Tuesday and Wednesday, respectively. These reports may provide some indication as to whether the Bank of England (BoE) will cut interest rates again at its March meeting.
Trading recommendation: GBPUSD: SELL 1.25800, SL 1.26300, TP 1.25100

GBPUSD 1HOUR CHART TECHNICAL ANALYSIS NEXT MOVE POSSIBLE This is a GBP/USD 1-hour chart published on TradingView. Here’s what it suggests:
1. Uptrend and Pullback: The price was in an upward channel but recently pulled back.
2. Support Zone (Blue Box): The highlighted blue area represents a potential support zone where price may bounce.
3. Resistance Level (1.26274): The red line above acts as resistance, where price may struggle to break.
4. Projected Move (Black & Blue Arrows):
The blue arrow suggests a possible bounce from support, leading to a break of resistance.
The black arrow indicates a bullish breakout continuation if resistance is broken.
This analysis suggests a long trade setup if GBP/USD respects the support and breaks resistance. Do you plan to trade based on this?

GBPUSD FORECASTHello traders! It's great week has started. This week is looking very promising guys as structures are looking very good. So today we have GBPUSD which is developing nicely. In this video, I've covered the way I look to take this trade when the opportunity presents itself. Let's look this guys with a close eye today

GBP/USD - Weekly OutlookHi all,
Top Down Analysis
Daily- Same figure as last weeks except breakout has been confirmed. I would expect price to return to the break before looking for larger Buy setups. 4H will explain this further
4H- Same as last week expect I notice all imbalance has been filled telling me bullish BIAS is still in play. Price has left one single Demand zone to return too so I will be making a trade of this 4H Mitigation
1H- As you can see I did predict the previous move pretty well so currently I do expect fundamentals to push price further down into this Demand zone to then push out of. I have marked a protected Low. We will watch this area before looking for trades
Good luck to any traders that follow this system

What is the trend of GBPUSD pair?GBP/USD News:
🔆The British pound (GBP) strengthened for the fifth consecutive day in early Asian trading, climbing back above the 1.2600 mark following a weak US retail sales report that indicated American consumers were cutting back on spending. The GBP/USD pair reached 1.2626, gaining over 0.50%.
🔆Market sentiment was heavily influenced by US President Donald Trump's tariff policies, with the US dollar remaining stable. US retail sales declined by more than -0.9% month-on-month in January, falling short of expectations of -0.1%, although December's numbers were revised up by 0.7%.
🔆In contrast, industrial production in the US rose by over 0.5% month-on-month in January, a slowdown from December's 1% increase but still above analysts' predictions of 0.3%.
🔆Meanwhile, stronger-than-anticipated UK GDP data contributed to the upward momentum of the GBP/USD pair.
Personal opinion:
🔆GBP will continue to rise in the short term and will wait for the speech of BOE Governor Bailey and the upcoming FOMC meeting minutes for investors to orient their upcoming strategies
Analysis:
🔆Based on economic information and tariff policies of the United States and related countries
Technical based on Resistance - Support Zones and important Fibonacci levels.
Plan:
🔆 Price Zone Setup:
👉Buy Gold 1.2330 – 1.2350
❌SL: 1.2280 | ✅TP: 1.2400- 1.2450 – 1.2500
👉Sell GBPUSD 1.2700 – 1.2715
❌SL: 1.2760 | ✅TP: 1.2650 – 1.2600– 1.2550

GBPUSD H4 | Bullish BounceBased on the H4 chart analysis, the price is approaching our buy entry level at 1.2564, a pullback support at aligns with the 38.2% Fibonacci retracement.
Our take profit is set at 1.2642, a pullback resistance.
The stop loss is placed at 1.2490, below the 38.2% Fibonacci retracement.
High Risk Investment Warning
Trading Forex/CFDs on margin carries a high level of risk and may not be suitable for all investors. Leverage can work against you.
Stratos Markets Limited (fxcm.com/uk):
CFDs are complex instruments and come with a high risk of losing money rapidly due to leverage. 63% of retail investor accounts lose money when trading CFDs with this provider. You should consider whether you understand how CFDs work and whether you can afford to take the high risk of losing your money.
Stratos Europe Ltd (fxcm.com/eu):
CFDs are complex instruments and come with a high risk of losing money rapidly due to leverage. 63% of retail investor accounts lose money when trading CFDs with this provider. You should consider whether you understand how CFDs work and whether you can afford to take the high risk of losing your money.
Stratos Trading Pty. Limited (fxcm.com/au):
Trading FX/CFDs carries significant risks. FXCM AU (AFSL 309763), please read the Financial Services Guide, Product Disclosure Statement, Target Market Determination and Terms of Business at fxcm.com/au
Stratos Global LLC (fxcm.com/markets):
Losses can exceed deposits.
Please be advised that the information presented on TradingView is provided to FXCM (‘Company’, ‘we’) by a third-party provider (‘TFA Global Pte Ltd’). Please be reminded that you are solely responsible for the trading decisions on your account. There is a very high degree of risk involved in trading. Any information and/or content is intended entirely for research, educational and informational purposes only and does not constitute investment or consultation advice or investment strategy. The information is not tailored to the investment needs of any specific person and therefore does not involve a consideration of any of the investment objectives, financial situation or needs of any viewer that may receive it. Kindly also note that past performance is not a reliable indicator of future results. Actual results may differ materially from those anticipated in forward-looking or past performance statements. We assume no liability as to the accuracy or completeness of any of the information and/or content provided herein and the Company cannot be held responsible for any omission, mistake nor for any loss or damage including without limitation to any loss of profit which may arise from reliance on any information supplied by TFA Global Pte Ltd.
The speaker(s) is neither an employee, agent nor representative of FXCM and is therefore acting independently. The opinions given are their own, constitute general market commentary, and do not constitute the opinion or advice of FXCM or any form of personal or investment advice. FXCM neither endorses nor guarantees offerings of third-party speakers, nor is FXCM responsible for the content, veracity or opinions of third-party speakers, presenters or participants.

GBPUSD Dusting 350+ PIPS in Choppy Waters - Breakout is Brewing?Technical / Chart Analysis:
Double Top Formation: The chart clearly exhibits a potential double top pattern around the 1.30564 resistance level. This is a bearish reversal pattern that suggests a potential trend change from bullish to bearish.
Breakdown of Uptrend: The preceding price action shows an uptrend, which has now been halted by the double top.
Key Support Level: The most crucial level to watch is the support around 1.28642. A confirmed break below this level would validate the double top pattern and signal a potential strong move downwards.
Monthly Performance: January saw a +180 pip move, followed by February with a +230 pip gain. This demonstrates the potential for significant profits in GBPUSD through swing trading.
Swing Analysis: February's +230 pip move consisted of 3 upward swings and 2 downward swings, highlighting the importance of capturing both upward and downward momentum in this pair due to the Choppy Price Action.
Conclusion:
FX:GBPUSD is at a critical juncture. The potential double top formation suggests a bearish bias, but confirmation is needed. Traders should closely monitor the key support level at 1.28642 for a potential breakdown and look for LONG Trades on breaking key levels to the Upside
What are your thoughts on GBPUSD's potential for swing trading? Do you see a breakdown or a bounce? Share your analysis and comments below!

GBPUSD 1D Trendline Broken - Reverse H&S - Bullish BiasTrendline clearly broken. Price has retraced and currently at support area. Also, there is reverse head and shoulders pattern.
Target 1.2800.
Be cautious with the plan / cut loss (your call) if daily candle close below 20 day Moving Average (MA).

Bullish rise?The Cable (GBP?USD) has reacted off the pivot and could potentially rise to the 1st resistance.
Pivot: 1.2508
1st Support: 1.2358
1st Resistance: 1.2844
Risk Warning:
Trading Forex and CFDs carries a high level of risk to your capital and you should only trade with money you can afford to lose. Trading Forex and CFDs may not be suitable for all investors, so please ensure that you fully understand the risks involved and seek independent advice if necessary.
Disclaimer:
The above opinions given constitute general market commentary, and do not constitute the opinion or advice of IC Markets or any form of personal or investment advice.
Any opinions, news, research, analyses, prices, other information, or links to third-party sites contained on this website are provided on an "as-is" basis, are intended only to be informative, is not an advice nor a recommendation, nor research, or a record of our trading prices, or an offer of, or solicitation for a transaction in any financial instrument and thus should not be treated as such. The information provided does not involve any specific investment objectives, financial situation and needs of any specific person who may receive it. Please be aware, that past performance is not a reliable indicator of future performance and/or results. Past Performance or Forward-looking scenarios based upon the reasonable beliefs of the third-party provider are not a guarantee of future performance. Actual results may differ materially from those anticipated in forward-looking or past performance statements. IC Markets makes no representation or warranty and assumes no liability as to the accuracy or completeness of the information provided, nor any loss arising from any investment based on a recommendation, forecast or any information supplied by any third-party.

GBPUSD Bullish Movement ContinuesOur analysis is based on multi-timeframe top-down analysis & fundamental analysis.
Based on our view the price will rise to the monthly level.
DISCLAIMER: This analysis can change anytime without notice and is only for assisting traders in making independent investment decisions. Please note that this is a prediction, and I have no reason to act on it, and neither should you.
Please support our analysis with a like or comment!
Let’s master the market together. Please share your thoughts and encourage us to do more by liking this idea.
